June 27 Lava Flow Update – 2/6/15
As the work week comes to a close, no advancement is seen in any of the downslope areas of the June 27 lava flow.
Hawai’i County Civil Defense said Friday morning following its overflight assessment of the flow that “visible activity was limited to breakouts within or on the surface of the lava pad and breakout along both margins of the further upslope.”
The north margin breakout that was the most recent advancing flow has remained stalled 0.36 miles from Highway 130, just west of the Pahoa Police and Fire stations since Jan. 26.
During Hawaiian Volcano Observatory’s Thursday afternoon mapping and assessment overflight, scientists noted that a breakout northeast of Puʻu ʻŌʻō that began more than a week ago continues to remain weakly active. Although still far upslope, the breakout has advanced about 1,420 yards since Jan. 29.
Following its overflight, HVO also noted additional breakouts near the True/Mid-Pacific well pad, located about 4.7-5.6 miles from the lowest tip of the flow 0.36 miles from the highway.
Close observation of flow advancement and activity continues to be monitored by Civil Defense and HVO.
Another day or moderate to heavy smoke and vog conditions should be expected as officials reported Friday morning that a light southwest wind was blowing smoke in a northeast direction. These conditions, as usual, have the potential to change and individuals who have respiratory difficulties are advised to take necessary precautions.
Civil Defense noted that burning activity associated with the brush fire breakout on Wednesday is limited to hot spots and flare-ups within the fire area. At this time, no communities are threatened and conditions are being watched closely.
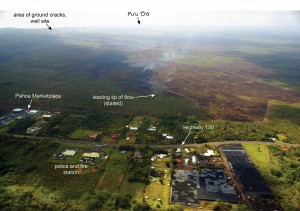
Although the leading tip of the flow remains stalled roughly 500 meters (550 yards) upslope of Highway 130, active breakouts persist a short distance upslope of the stalled tip. These active breakouts are evident in this photo taken on Feb. 6, as small smoke plumes on the flow margin, where lava is burning vegetation. USGS HVO photo.
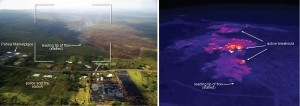
This comparison of a normal photograph and a thermal image, done on Feb. 5, shows the position of active breakouts relative to the inactive flow tip. The white box shows the rough extent of the thermal image on the right. In the thermal image, active breakouts are visible as white and yellow areas. USGS HVO image.
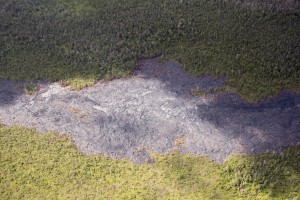
This section of the flow, which has cut through forest west of Kaohe Homesteads, is relatively narrow. In the left portion of the photograph, taken on Feb. 5, the flow is slightly more than 100 meters (110 yards) wide. USGS HVO photo.
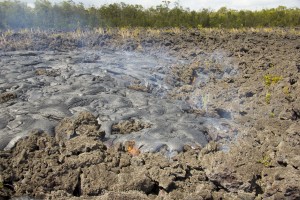
In this photo, taken on Feb. 5 breakouts that were also active in the upper portion of the flow field are seen. This pāhoehoe lava is flowing over ʻaʻā erupted from Puʻu ʻŌʻō in the 1980s. USGS HVO photo.
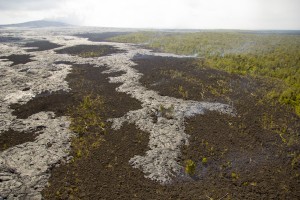
A wider view of the breakout in the upslope portion of the June 27 flow. Active surface lava was about 3.5 km (2.2 miles) northeast of Puʻu ʻŌʻō, which can be seen in the upper left corner of the photo taken on Feb. 5. USGS HVO photo.
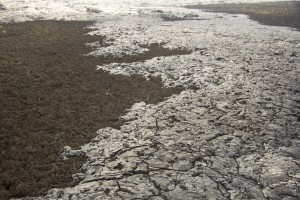
The pāhoehoe breakout northeast of Puʻu ʻŌʻō is seen in this photo, taken on Feb. 5, covering older (1980s) ʻaʻā. Many pieces of the old ʻaʻā clinker were surrounded by the solidifying pāhoehoe, and then lifted by the inflating flow surface. USGS HVO photo.
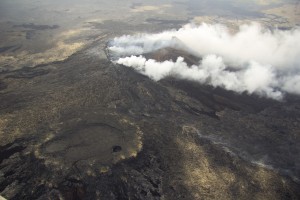
This view looks west at Puʻu ʻŌʻō. In the lower left portion of the photograph, the circular perched lava pond that was active in early July can be seen. Just to the right of this perched lava pond, a line of white fume can be seen extending to the lower right corner of the image, taken on Feb. 5. This fume marks the path of the subsurface lava tube for the June 27 lava flow. The vent for the June 27 flow, and the start of the lava tube, is slightly below the center point of the photograph. USGS HVO photo.
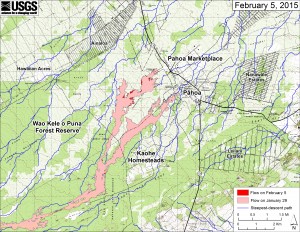
This large-scale map shows the distal part of Kīlauea’s active East Rift Zone lava flow in relation to nearby Puna communities. The area of the flow on Jan. 29 is shown in pink, while widening and advancement of the flow as of Feb. 5 is shown in red. The blue lines show steepest-descent paths calculated from a 1983 digital elevation model. USGS HVO map.
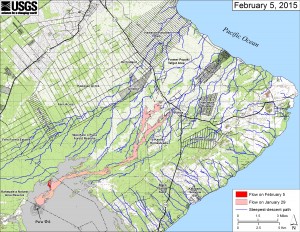
This small-scale map shows Kīlauea’s active East Rift Zone lava flow in relation to lower Puna. The area of the flow on Jan. 29 is shown in pink, while widening and advancement of the flow as of Feb. 5 is shown in red. The blue lines show steepest-descent paths calculated from a 1983 digital elevation model. USGS HVO map.


