

USGS Releases New Map of East Rift Zone
The U.S. Geological Survey (USGS) released this map of the current eruptions happening in Leilani Estates.

Map as of 1 p.m., May 18, 2018. Shaded purple areas indicate lava flows erupted in 1840, 1955, 1960, and 2014-2015. Click to enlarge. (USGS Map)
This thermal map shows a close up of the northeastern end of the fissure system, as of 12:15 p.m. on May 18, 2018. The Fissure 17 lava flow had not advanced a significant distance over the past day, but the Fissure 18 flow traveled approximately 1 km (0.6 miles) over the past day. The black and white area is the extent of the thermal map.
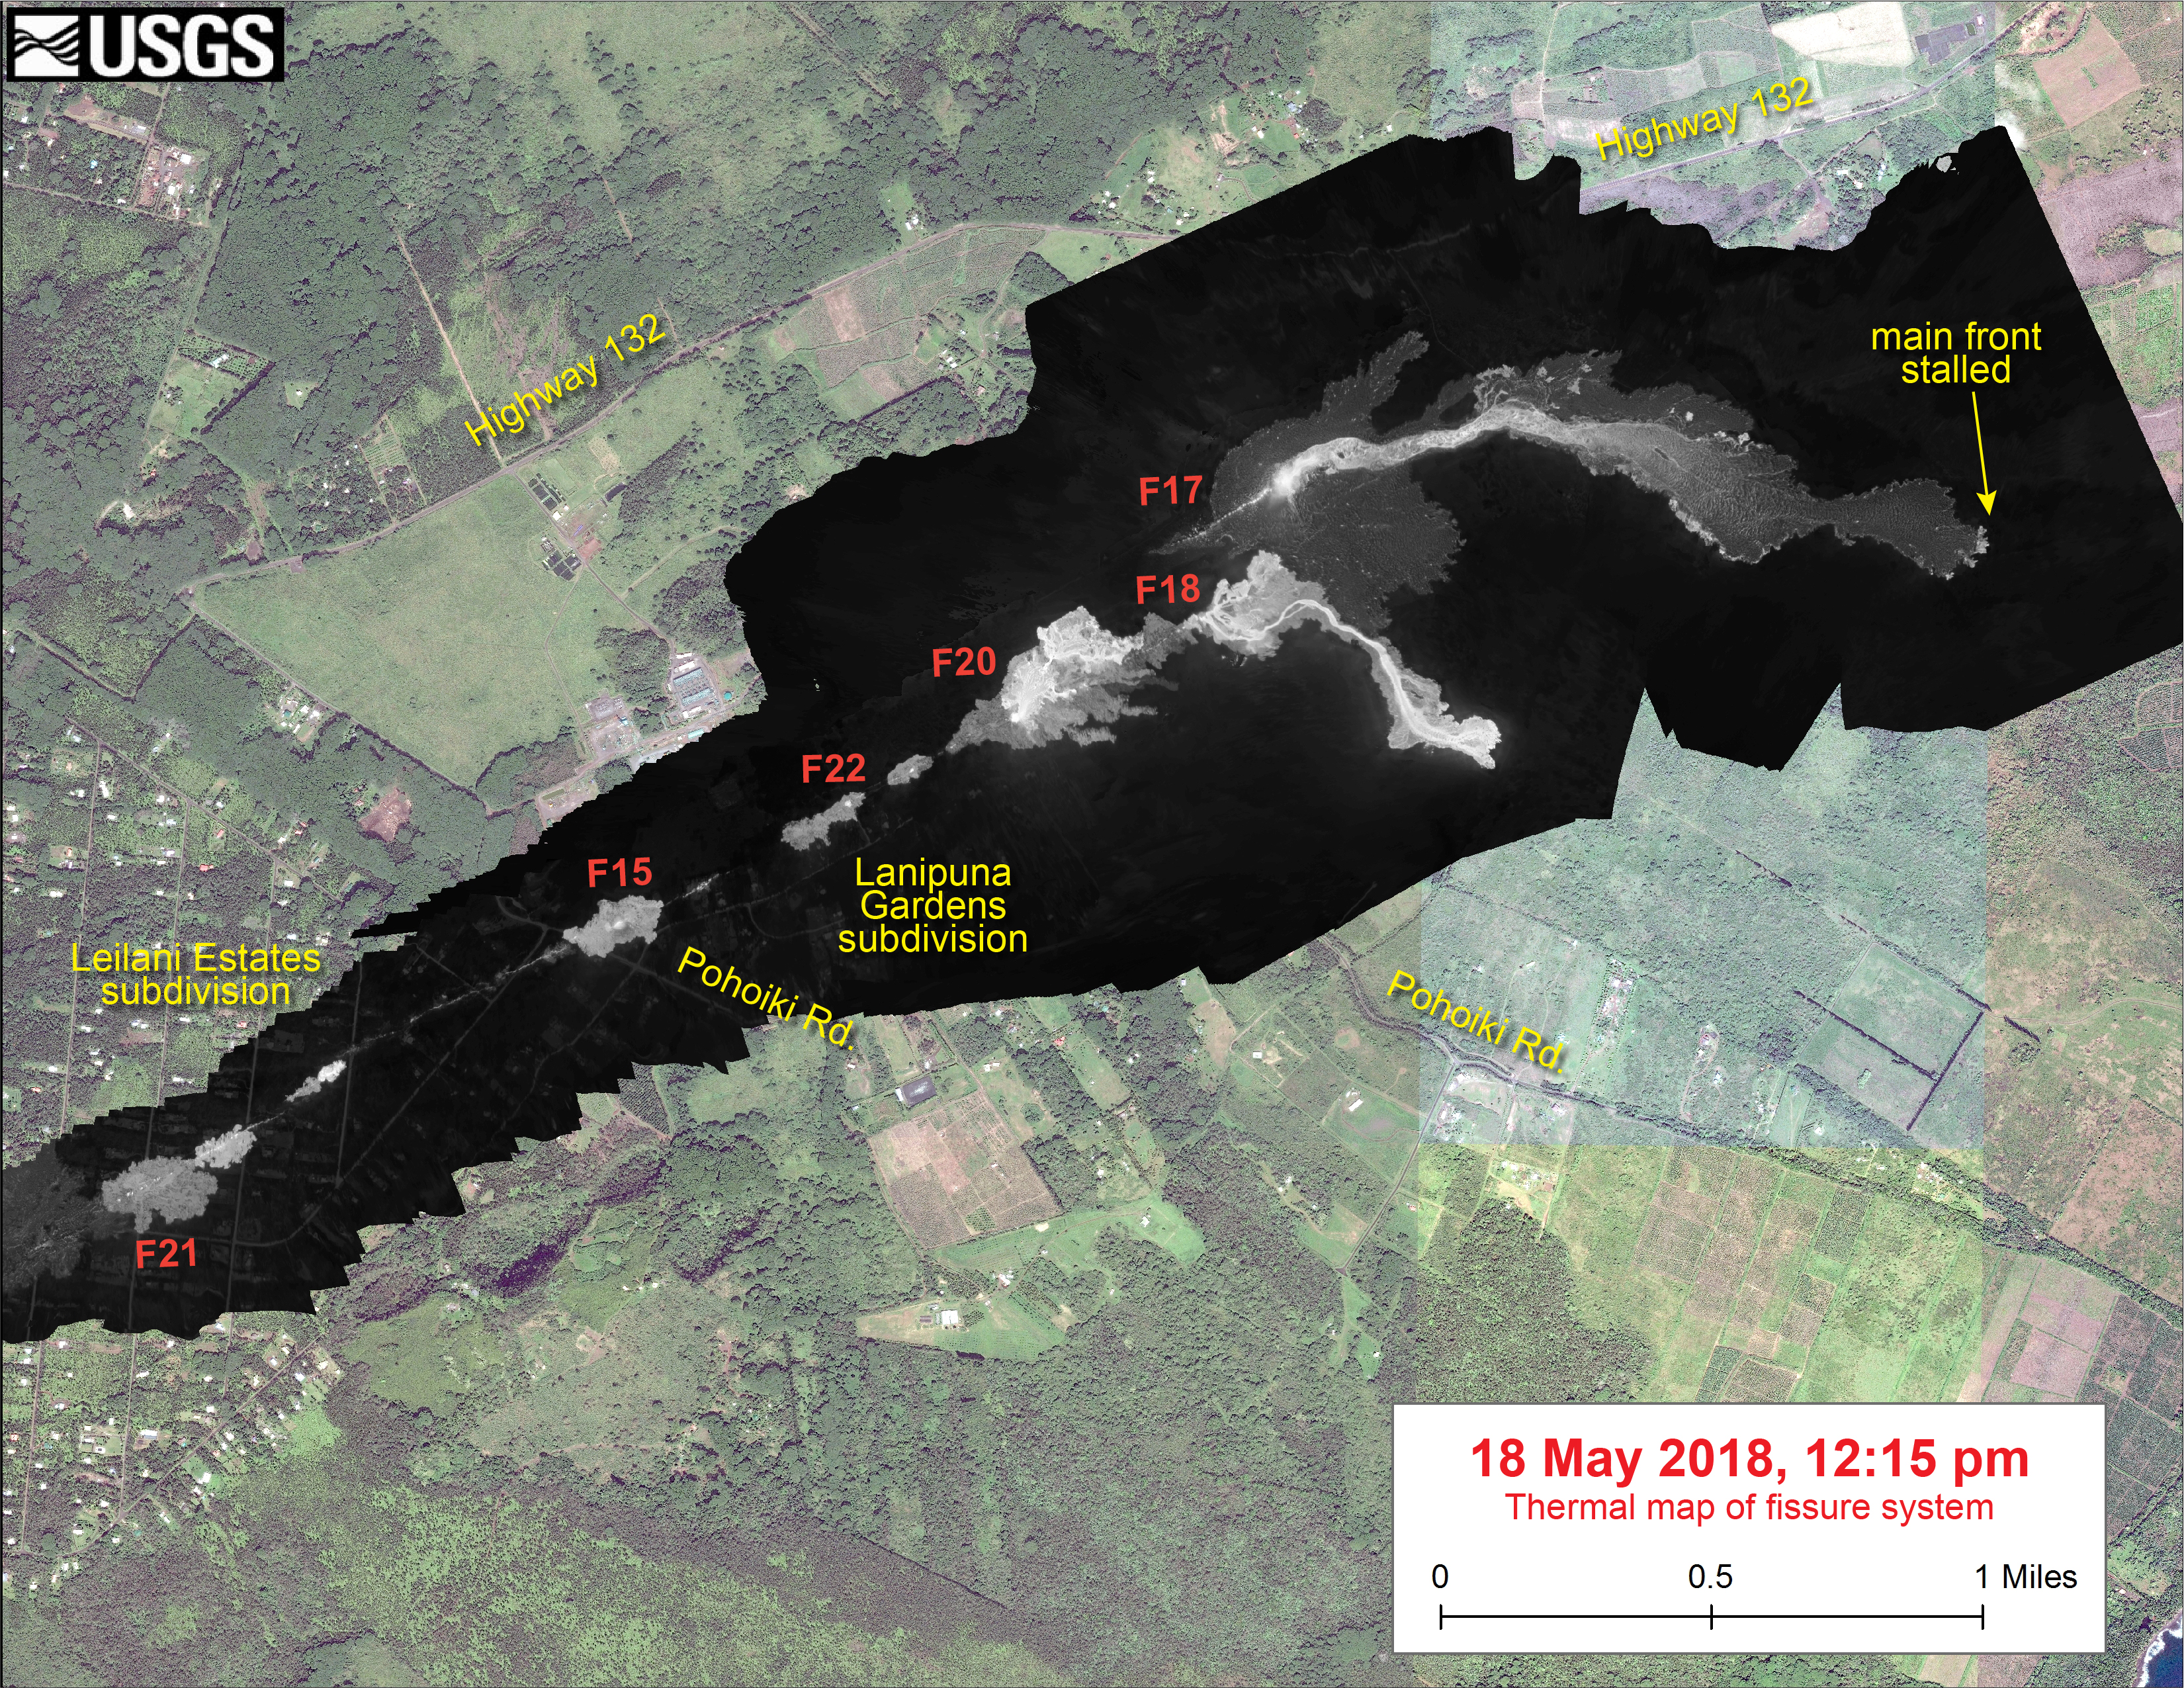
The thermal map was constructed by stitching many overlapping oblique thermal images collected by a handheld thermal camera during a helicopter overflight of the flow field. The base is a copyrighted color satellite image (used with permission) provided by Digital Globe. Click to enlarge. (USGS Photo)
Temperature in the thermal image is displayed as gray-scale values, with the brightest pixels indicating the hottest areas.
Sponsored Content

_1770333123096.webp)

