

UPDATE: June 27 Lava Flow Update – 2/11/15
***Note: This story was updated at 9:30 a.m. to include Hawai’i County Civil Defense’s overflight observations.***
Hawai’i County Civil Defense’s morning overflight of the June 27 lava flow that was delayed Wednesday morning was conducted.
At 8:45 a.m., Civil Defense said that no signs of forward advancement in downslope areas of the lava flow were observed.
Officials say none of the current lava activity poses a threat to communities in the area. Observations of the flow will continue and the public will continue to be informed of any changes.
Smoke and vog conditions were reported by Civil Defense as light to moderate as a light south wind was blowing smoke in a north/northeast direction.
*** Original story was posted at 8:01 a.m.***
Hawai’i County Civil Defense’s Wednesday morning overflight assessment of the June 27 lava flow has been delayed.
On Tuesday, Hawaiian Volcano Observatory scientists were in the air.
During HVO’s overflight, scientists mapped its perimeter.
Officials say that during the overflight, the leading edges of the two active lobes of lava to the north and east appeared to be inactive, however, small breakouts across the interior and along the edges of the lobe were active.
The breakout that was previously heading in the direction of the Pahoa Police and Fire stations continued to remain stalled Tuesday afternoon. HVO scientists observed small breakouts stemming from the flow 0.2 to 1.7 miles upslope from the inactive tip.
Further upslope, near the junction of the flow’s two main branches, west of Kahoe Homestead and in the crack system, more breakouts were observed.
HVO also noted that the breakout northeast of Puʻu ʻŌʻō that began about two weeks ago continued to show activity. Since Feb. 5, the flow in this area appeared to have advanced about 480 yards.
Lava being discharged from the vent has not changed in the past week, according to HVO, as measurements of the cross-sectional area of the lava stream in the tube flank remained the same.
The Pahoa community lava meetings that have been held nearly weekly since August have been suspended, as the decrease in advancement and limited activity allows for a break.
Civil Defense Administrator Darryl Oliveira has ensured the public that should any changes occur, the meeting will be scheduled once again.

This photo, taken on Feb. 10, shows the leading tip of the June 27 flow that has been stalled roughly 500 meters (550 yards) upslope of Highway 130 for several weeks. Breakouts have persisted upslope of this stalled tip. USGS HVO photo.

This comparison of a normal photograph and a thermal image, taken on Feb. 10, shows the position of active breakouts relative to the inactive flow tip. The white box shows the rough extent of the thermal image on the right. In the thermal image, active breakouts are visible as white and yellow areas. Although active breakouts are absent at the inactive tip of the flow, breakouts are present just a short distance behind the tip, and are also scattered further upslope. USGS HVO image.

Roughly 4 miles upslope of the stalled tip of the flow, a small breakout was active at a major fork on the June 27 flow. The lobe extending off the top of the photo, taken on Feb. 10, entered Pāhoa in October and is now inactive. The lobe extending off the left edge of the photograph is the currently active lobe. USGS HVO photo.

In this photo, taken on Feb. 10, a breakout that was also active farther upslope, closer to Puʻu ʻŌʻō is seen. This breakout, visible as the light gray surface, has reached the forest boundary and triggered several small brush fires. USGS HVO photo.

The summit lava lake in the Halemaʻumaʻu Crater seen in this photo, taken on Feb. 10, continues with relatively steady activity. On Tuesday, spattering was active along the south margin of the lava lake. USGS HVO photo.

This large-scale map uses a satellite image acquired in March 2014 (provided by Digital Globe) as a base to show the area around the front of Kīlauea’s active East Rift Zone lava flow. The area of the flow on Feb. 5 is shown in pink, while widening and advancement of the flow as of February 10 is shown in red. The blue lines show steepest-descent paths calculated from a 1983 digital elevation model. USGS HVO map.

This map overlays a georegistered mosaic of thermal images collected during a helicopter overflight of the distal part of Kīlauea’s active East Rift Zone lava flow on Feb. 10 at about 12:30 PM. The base image is a satellite image acquired in March 2014 (provided by Digital Globe). The perimeter of the flow at that time is outlined in yellow. Temperature in the thermal image is displayed as gray-scale values, with the brightest pixels indicating the hottest areas (white shows active breakouts). The blue lines show steepest-descent paths calculated from a 1983 digital elevation model. USGS HVO map.

This large-scale map shows the distal part of Kīlauea’s active East Rift Zone lava flow in relation to nearby Puna communities. The area of the flow on Feb. 5 is shown in pink, while widening and advancement of the flow as of Feb. 10 is shown in red. The blue lines show steepest-descent paths calculated from a 1983 digital elevation model. USGS HVO map.

This small-scale map shows Kīlauea’s active East Rift Zone lava flow in relation to lower Puna. The area of the flow on Feb. 5 is shown in pink, while widening and advancement of the flow as of Feb. 10 is shown in red. The blue lines show steepest-descent paths calculated from a 1983 digital elevation model. USGS HVO map.

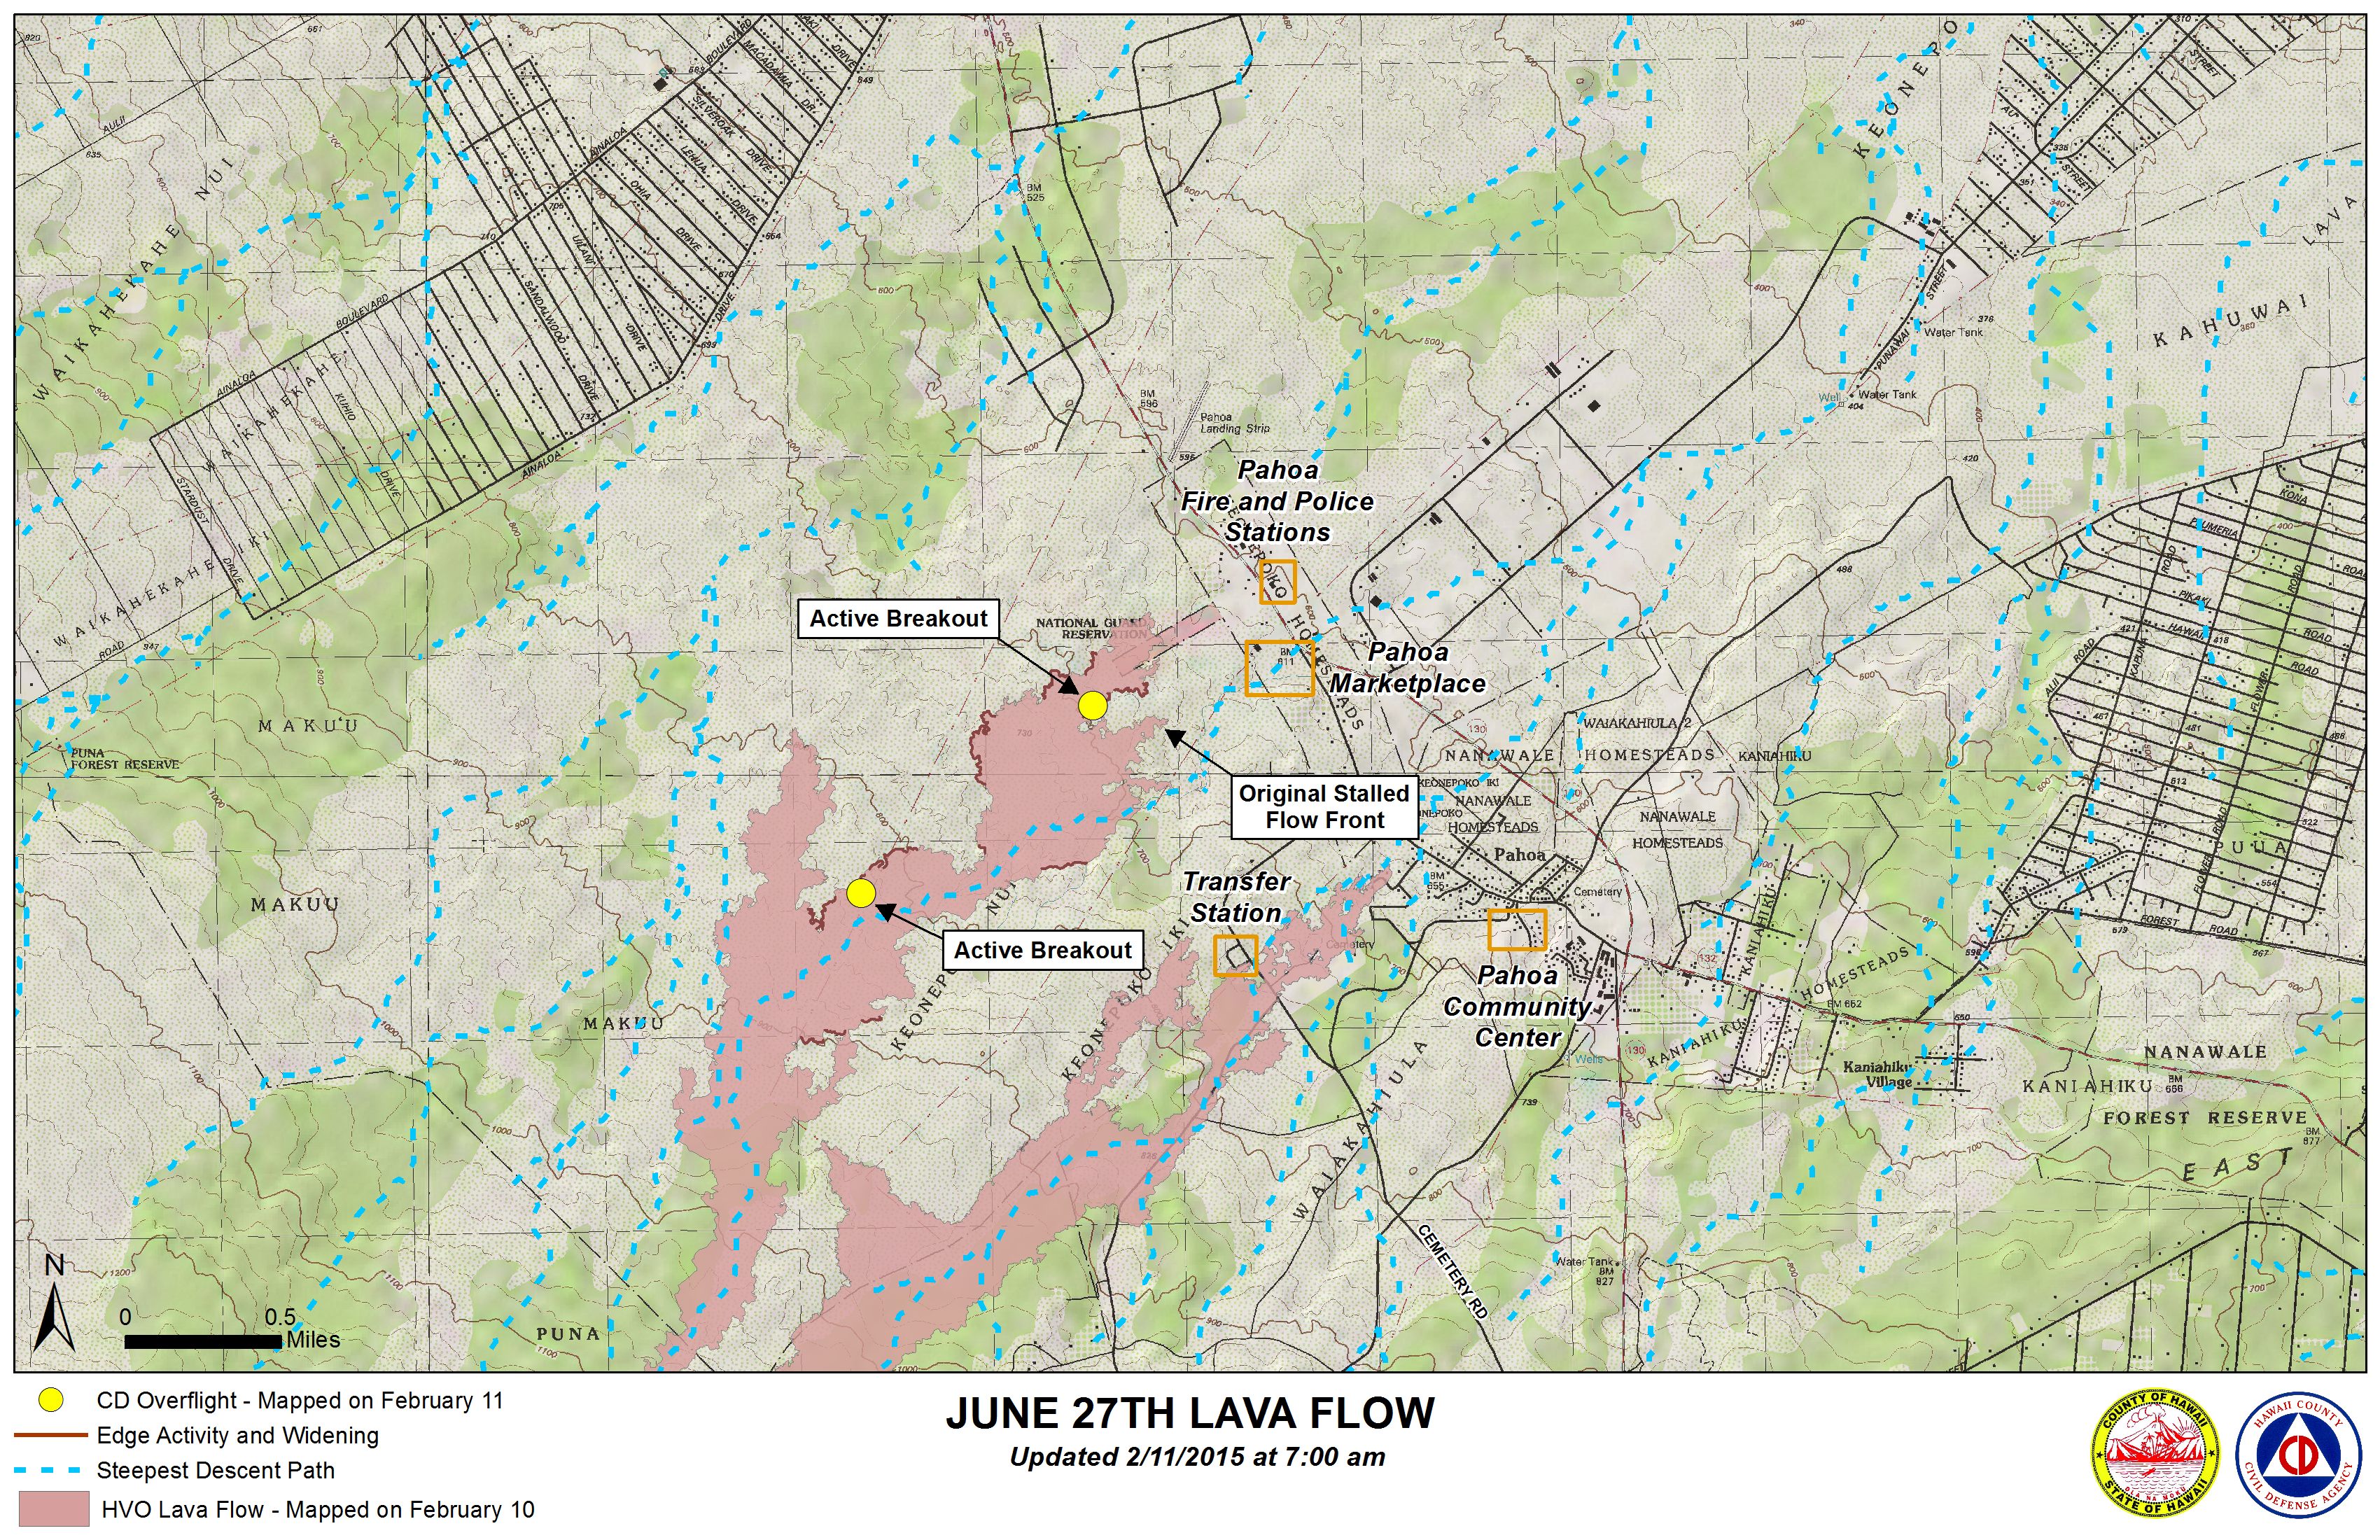
Hawai’i County Civil Defense lava flow map, as of Feb. 11 at 7 a.m. Civil Defense image.

Hawai’i County Civil Defense lava flow map, as of Feb. 11 at 7 a.m. Civil Defense image.

Hawai’i County Civil Defense lava flow map, as of Feb. 11 at 7 a.m. Civil Defense image.
Sponsored Content


