VOLCANO WATCH: Survey Helps Finalize USGS Lava Thickness Map
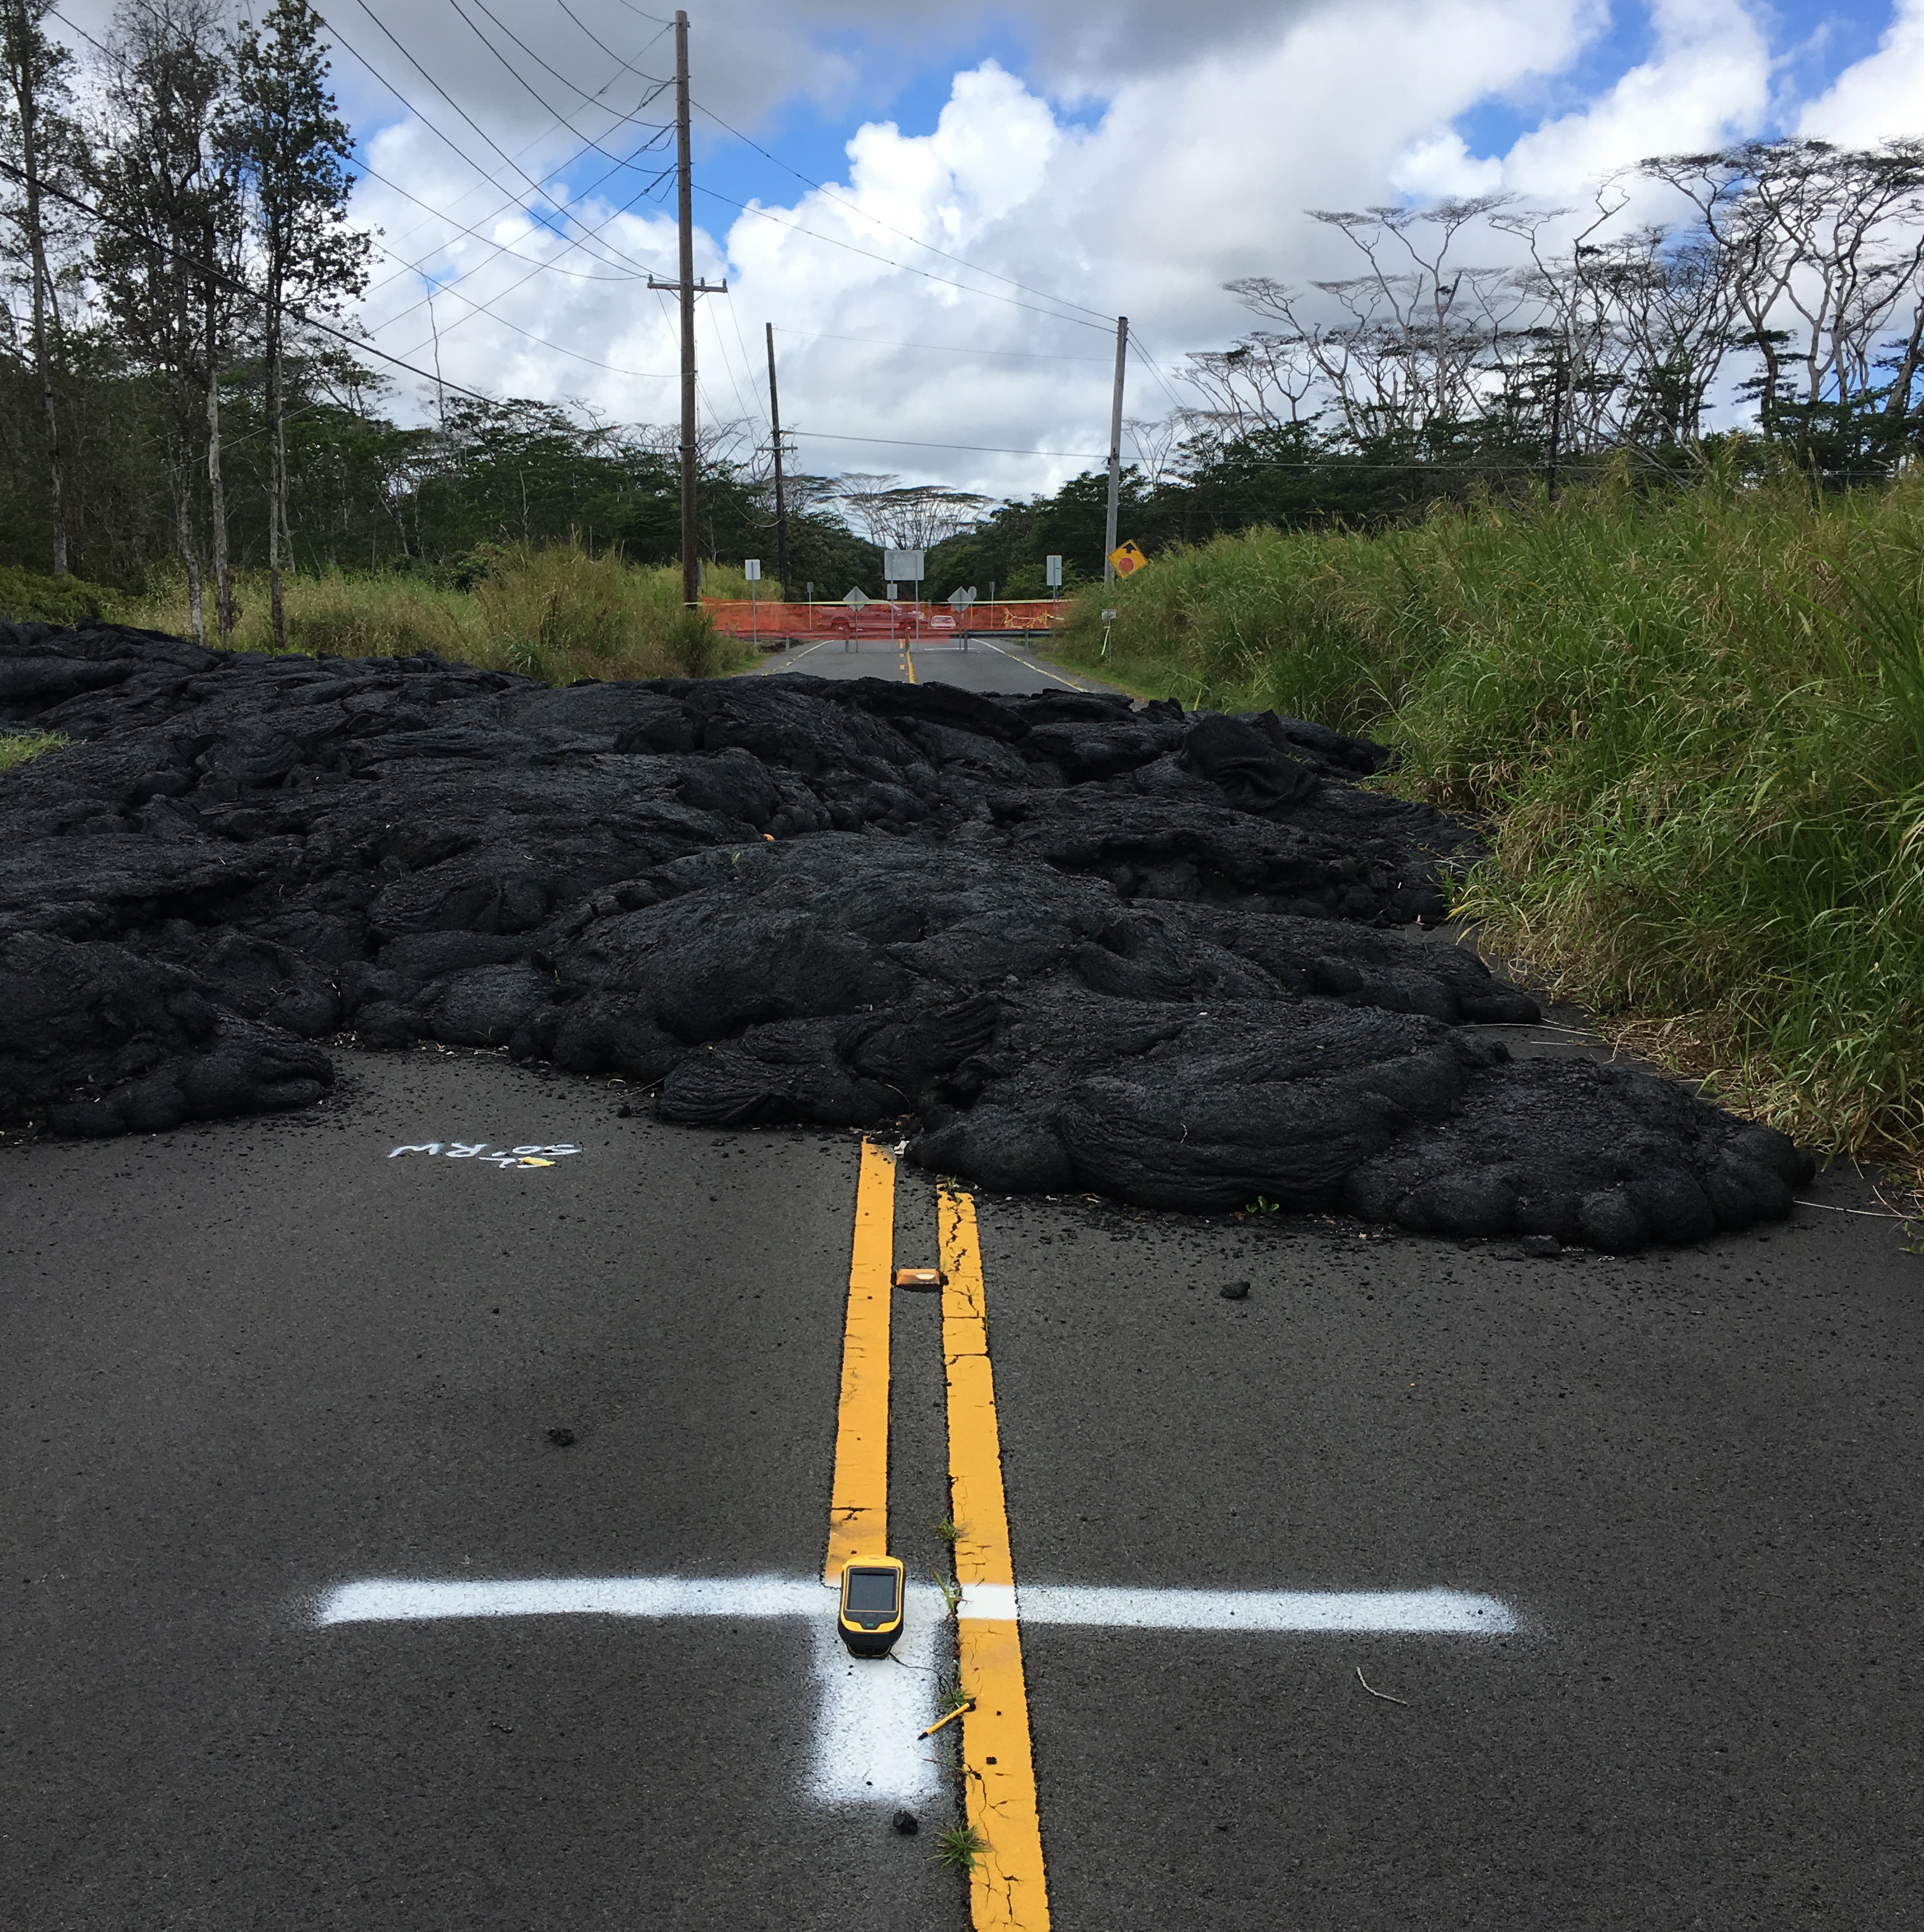
A high-precision GPS unit (on white “T” in foreground) records its position at a ground control point along Pohoiki Road. This marker was painted in July 2018 and is visible in numerous aerial photographs taken by USGS Hawaiian Volcano Observatory geologists throughout Kīlauea’s lower East Rift Zone eruption last summer. GPS data are recorded over a period of four minutes at each location, enabling vertical precision of approximately 18 cm (7 in). PC: USGS photo by M. Zoeller, 03/22/2019.
In February 2019, the USGS Hawaiian Volcano Observatory (HVO) released a preliminary map of lava flow thicknesses for Kīlauea Volcano’s 2018 lower East Rift Zone eruption.

This map was produced by comparing pre- and post-eruption models of the flow field.
There were two primary reasons the lava flow thickness map was considered preliminary when released, and HVO geologists have been working to resolve those issues.
First, the August 2018 unmanned aerial systems (UAS) flights, which collected images to build the lava thickness model, were unable to survey the entire flow due to range limitations of the aircraft. Last month, HVO geologists corrected the deficiency by completing a helicopter photographic survey of the missing areas, mainly flows in the Malama-Kī forest southwest of Pohoiki Road. This will enable construction of another digital elevation model (DEM) using structure-from-motion (SFM) techniques, similar to the DEM from the UAS images, with which it will be joined.
Second, the DEM made from the UAS images required better “geolocation”—real-world geographic placement.
It’s fairly simple to build a three-dimensional model using SFM software, which automatically analyzes features common to multiple images to determine their relative positions. The tricky part is getting the software to understand where the model should be placed geographically on the globe. Because the feature positions are only relative, the SFM software has no knowledge—initially—of their absolute locations, so the model could be “floating in space” as far as it can tell.
Fortunately, the UAS carried a Global Positioning System (GPS) receiver that stored latitude, longitude, and altitude data for each image it collected. When the SFM software analyzes these data, it can place the resulting model on the globe. In other words, when a feature is visible in two or more photographs, and we know the geographic location of the UAS when each photo was snapped, it’s possible to triangulate the geographic position of the feature on the ground.
However, the geographic triangulation process is not perfect, which caused some errors in the resulting model.
Comparison with other lower East Rift Zone DEMs from Light Detection and Ranging (LiDAR) surveys—completed before and during the 2018 eruption—showed that the surface of the SFM DEM diverged by as much as 10 feet vertically, even in places not inundated by lava. This meant that some lava thicknesses on the preliminary map were slightly overestimated, while others were underestimated.
The solution devised by HVO geologists to correct these errors has been to complete a ground control survey around the 2018 flow field. Features visible in the UAS images are surveyed on the ground using a high-precision GPS unit, which provides a known latitude, longitude, and elevation at a certain point in the DEM. Each ground control point (GCP) is then used to “tie down” the surface of the DEM so that it no longer “floats above” or “dives below” the actual ground surface.
HVO geologists have now identified and surveyed 23 GCPs dispersed around the 2018 lava flow. Ideal features are distinct, sharp, and flat so that the coordinates can be placed in the model with pinpoint accuracy using the SFM software. The features also need to be unmoved since August 2018, when the UAS imagery was collected.
During the eruption, USGS geologists intentionally painted several GCPs onto abandoned roads because that is the ideal way to conduct a ground control survey. Unfortunately, access limitations at the time prevented an even distribution of the GCPs. As a result, it has been necessary in our recent survey to use preexisting features, such as the ends of roadway centerlines or the corners of concrete slabs, for GCPs.
The 23 GCPs were accessed by air or from the ground (including hikes through dense forest), all in the interest of achieving a uniform distribution around the 2018 lava flow. Preliminary results are encouraging, as the GCP elevations fall consistently within 3 feet of the surfaces in the LiDAR DEMs.
Work to reprocess the structure-from-motion DEM with the ground control data is ongoing, but it should result in HVO’s publication of a finalized lava thickness map—hopefully in the near future—for Kīlauea Volcano’s 2018 lower East Rift Zone eruption.
Sponsored Content