

New USGS Map Shows Location of New Crack in Kīlauea
The United States Geological Survey (USGS) has released a new map that shows recent changes to Kīlauea’s East Rift Zone field and Pu‘u ‘Ō‘ō cone.
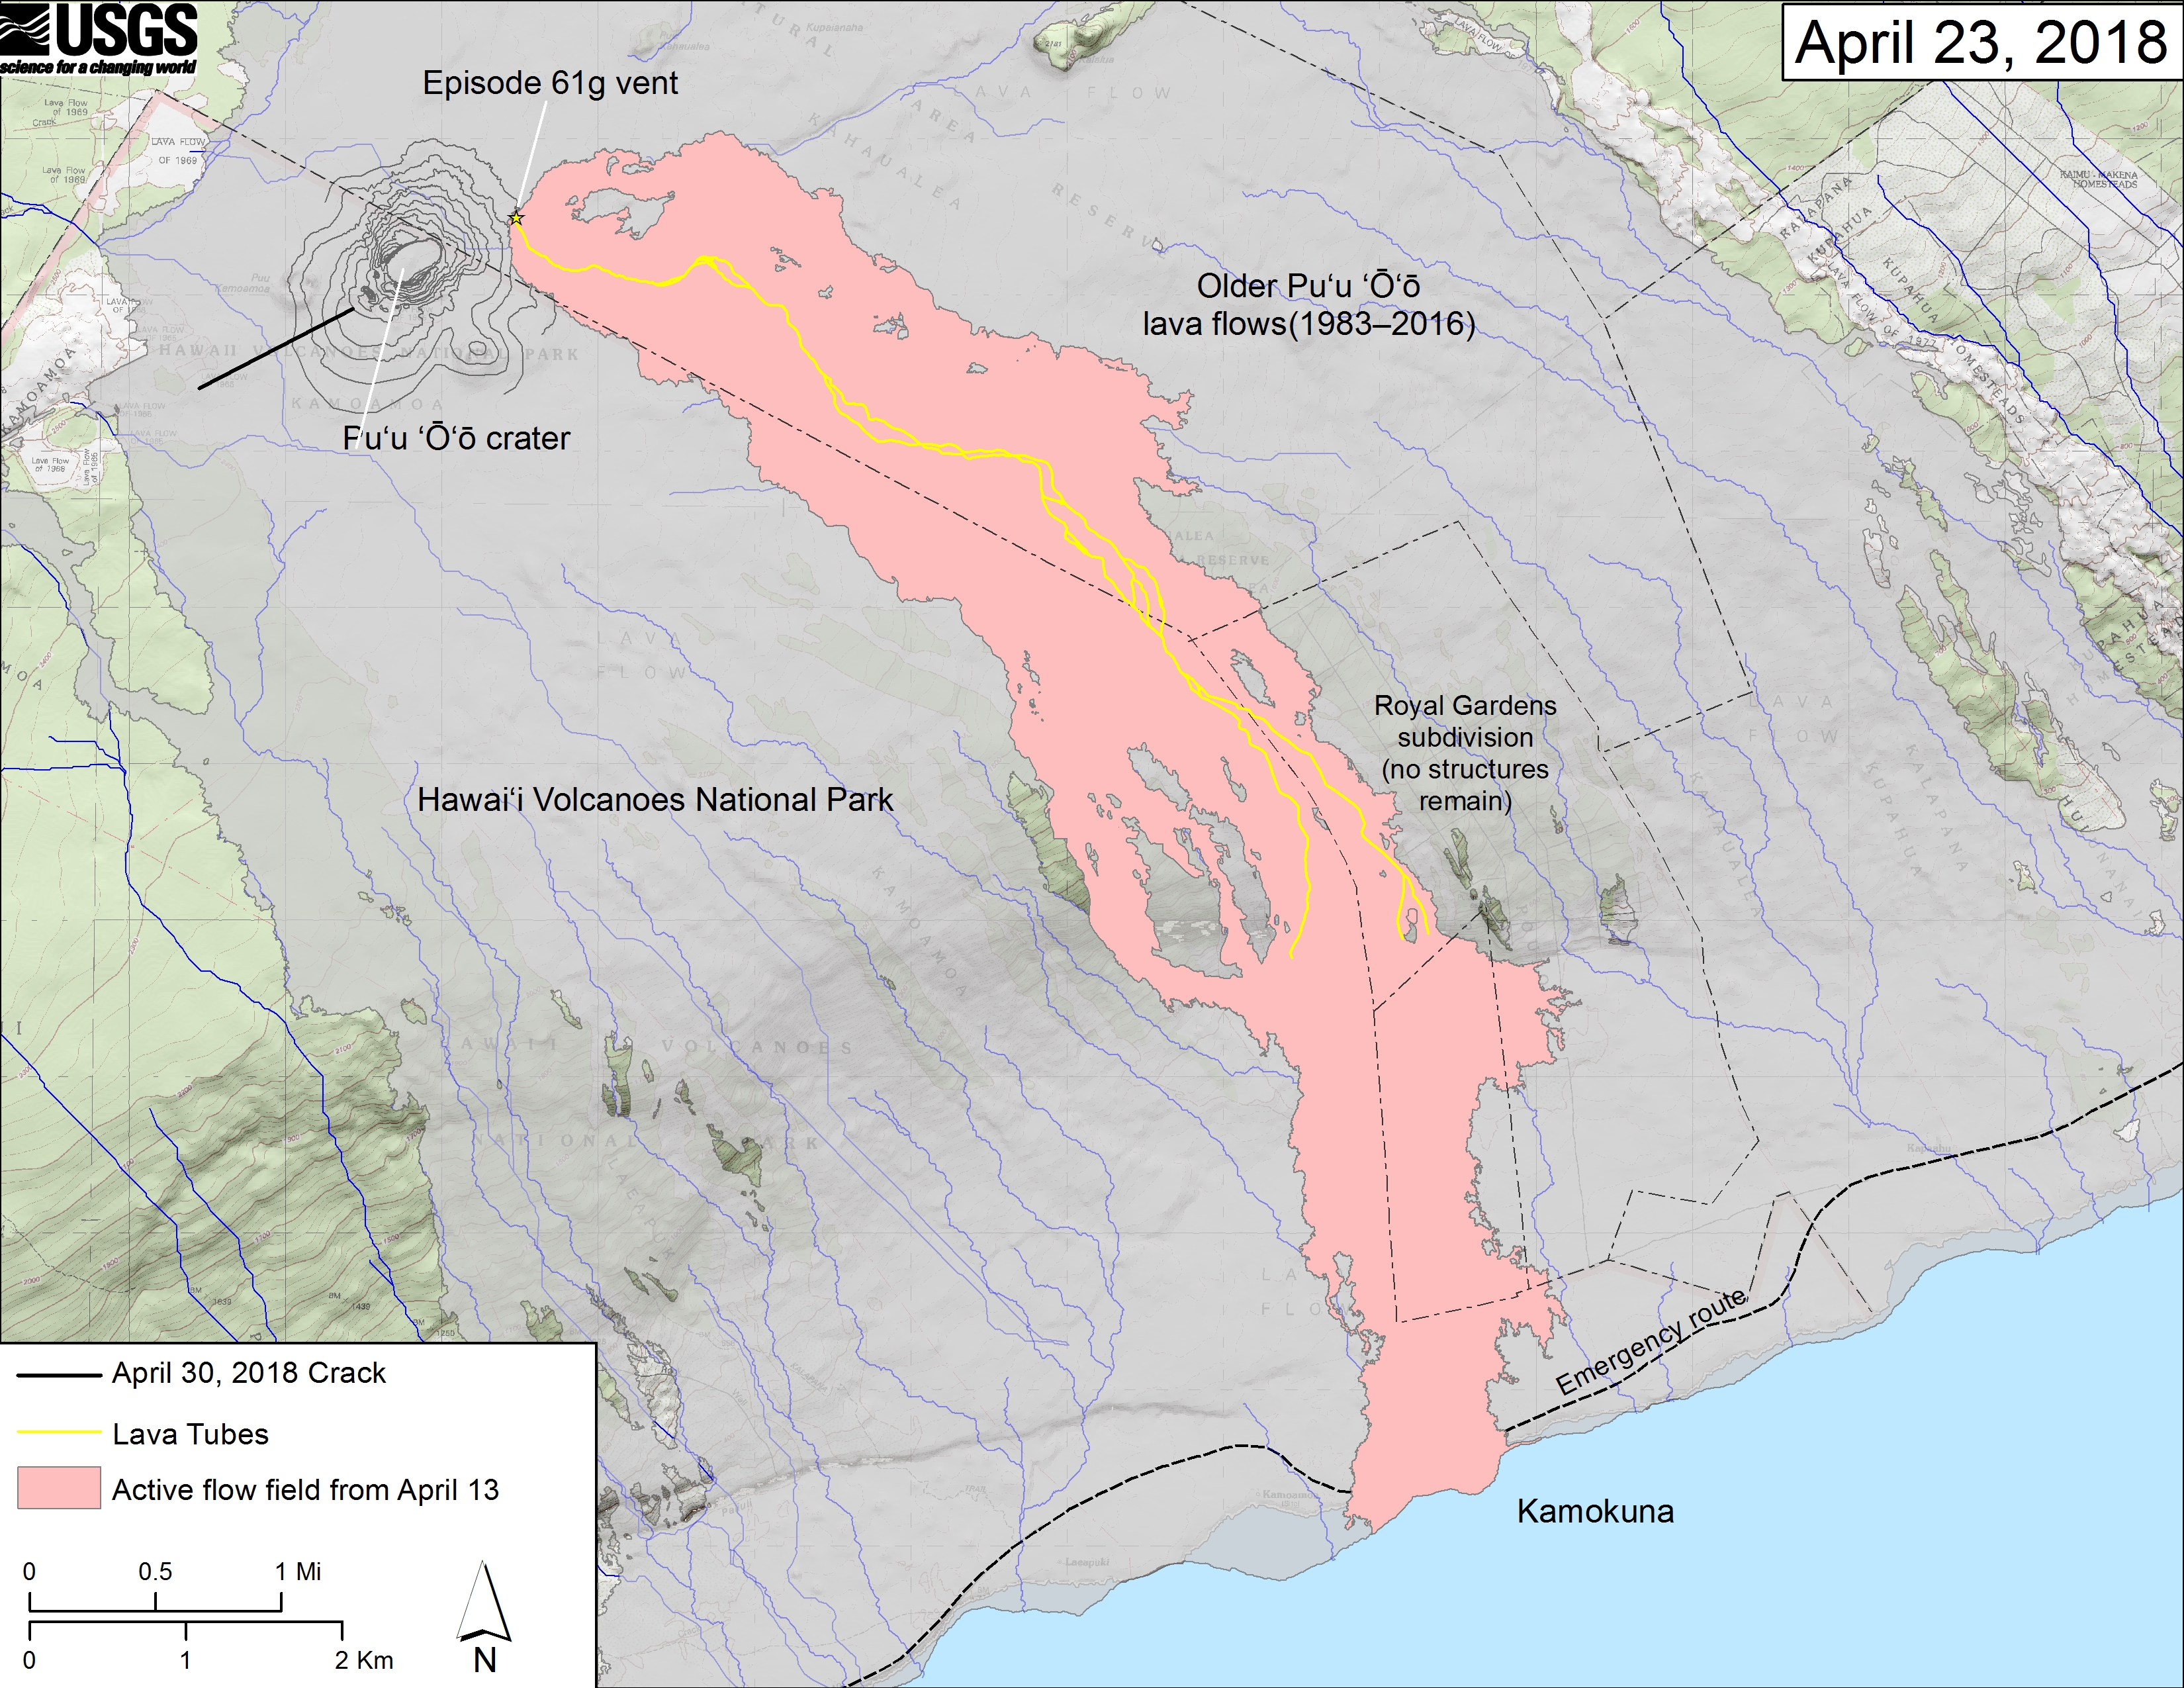
The 61g flow field, as of Friday, April 13, 2018, is shown in pink. The crack that formed on the west side of Pu‘u ‘Ō‘ō on April 30th, 2018, during or immediately after the crater floor collapse is shown as a solid black line.
Steepest-descent path analysis is based on the assumption that the DEM perfectly represents the earth’s surface. DEMs, however, are not perfect, so the blue lines on this map can be used to infer only approximate flow paths. The base map is a partly transparent 1:24,000-scale USGS digital topographic map draped over the 1983 10-m digital elevation model (DEM). MC: USGS
Older Pu‘u ‘Ō‘ō lava flows (1983–2016) are shown in gray. The yellow line is the trace of the active lava tubes. The Kamokuna ocean entry is inactive. The blue lines over the Pu‘u ‘Ō‘ō flow field are steepest-descent paths calculated from a 2013 digital elevation model (DEM), while the blue lines on the rest of the map are steepest-descent paths calculated from a 1983 DEM (for calculation details, see http://pubs.usgs.gov/of/2007/1264/).
Sponsored Content


