June 27 Lava Flow Update – 3/18/15
The downslope portions of the June 27 lava flow continue to show little to no activity, according to Hawai’i County Civil Defense following its Wednesday morning overflight assessment of the June 27 lava flow.
Beginning about 8 miles upslope from the stalled flow fronts and headed all the way up to the summit area, small breakouts continue to be observed. Three breakouts have been of particular interest in Hawaiian Volcano Observatory’s daily observations.
According to Civil Defense, none of the current flow activity is posing an immediate threat to communities. The agency, along with HVO, will continue to monitor conditions and keep the public informed of any changes.
Moderate smoke and vog conditions were observed Wednesday morning as a light south wind was blowing the smoke and vog in a northeast direction. These conditions have the possibility of increasing and those who are sensitive are advised to take necessary precautions, including staying inside.
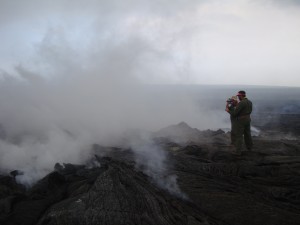
After establishing an appropriate location to resume VLF measurements over the June 27 lava tube to estimate the cross-sectional area of lava within the tube, HVO geologists on March 17 make the measurements, sometimes requiring walking through volcanic gases. USGS HVO photo.
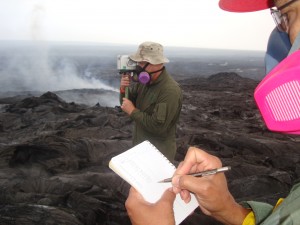
The VLF radio wave, transmitted from the Lualualei Naval Base on Oʻahu, is received by the handheld device. The numbers are read and recorded. The data will allow the estimation of the cross-sectional area of lava within the tube. This photo, taken March 17, shows scientists going through the process. USGS HVO photo.
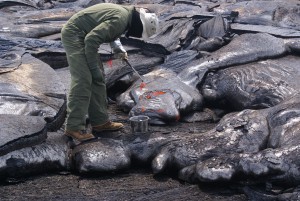
In this photo, taken March 17, a Hawaiian Volcano Observatory geologist gets a fresh lava sample closest to the vent as possible. The sample is sent to the University of Hawai’i at HIlo for quick analysis of a few components and prepared for a fuller analysis of its chemical components by a lab on the mainland. USGS HVO photo.
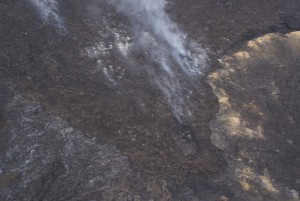
Most of Hawaiian Volcano Observatory’s ground work on March 17 was to establish the location and estimated size of the two lava tubes coming out of the June 27 vent area on the north flank of Puʻu ʻŌʻō cone. The area in this image is between the cone’s north flank and a perched pond that formed last summer (arc-shaped feature on the right side of the image). The visual image shows the general location of the main tube before it splits downslope. USGS HVO photo.
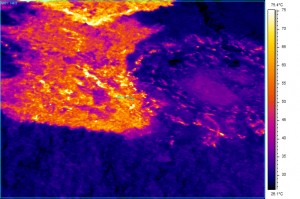
This infrared view of the area in the image taken on March 17 shows that the area is still quite hot and the tube location is possibly obscured, although the few hotter strands may be indicators of the tube’s location. USGS HVO photo.
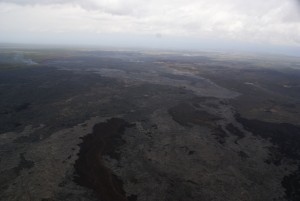
The March 9 breakouts, which issued from the vicinity of Puʻu Kahaualeʻa, are advancing northward (to the left) and reached the forest at the north edge of the Kahaualeʻa flows and was burning vegetation along its edges on March 17, when this photo was taken. USGS HVO photo.
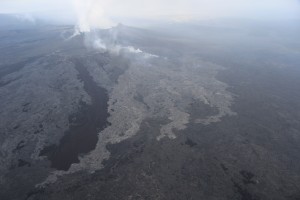
In this photo, taken March 17, you can see Pāhoehoe lobes that continue to be active at the leading edge of the February 21 breakout. USGS HVO photo.
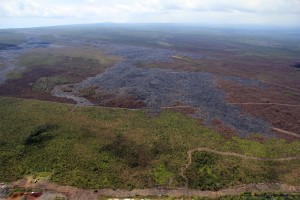
This photo, taken March 17, shows the downslope portion of the June 27 lava flow. As reported since March 12, the leading edge, just upslope of the Pahoa Marketplace, is inactive. The active breakouts noted Tuesday were more than 14 km (8.7 mi) straight-line distance from the Marketplace. USGS HVO photo.
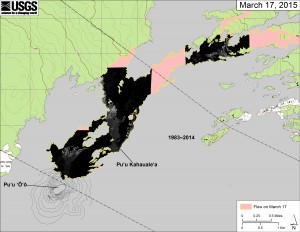
This map overlays georegistered mosaics of thermal images collected during a helicopter overflight of the three areas of breakouts near Puʻu ʻŌʻō on March 17 at about 8 a.m. The perimeter of the flow at the time the imagery was acquired is outlined in yellow. The temperature in the thermal mosaic is displayed as gray-scale values, with the brightest pixels indicating the hottest areas. USGS HVO map.


