


New study finds short, intense storms gain intensity throughout Hawaiʻi
While long-term data show Hawaiʻi is becoming overall drier, short intense downpours that cause sudden and dangerous flash flooding are getting stronger throughout the islands.
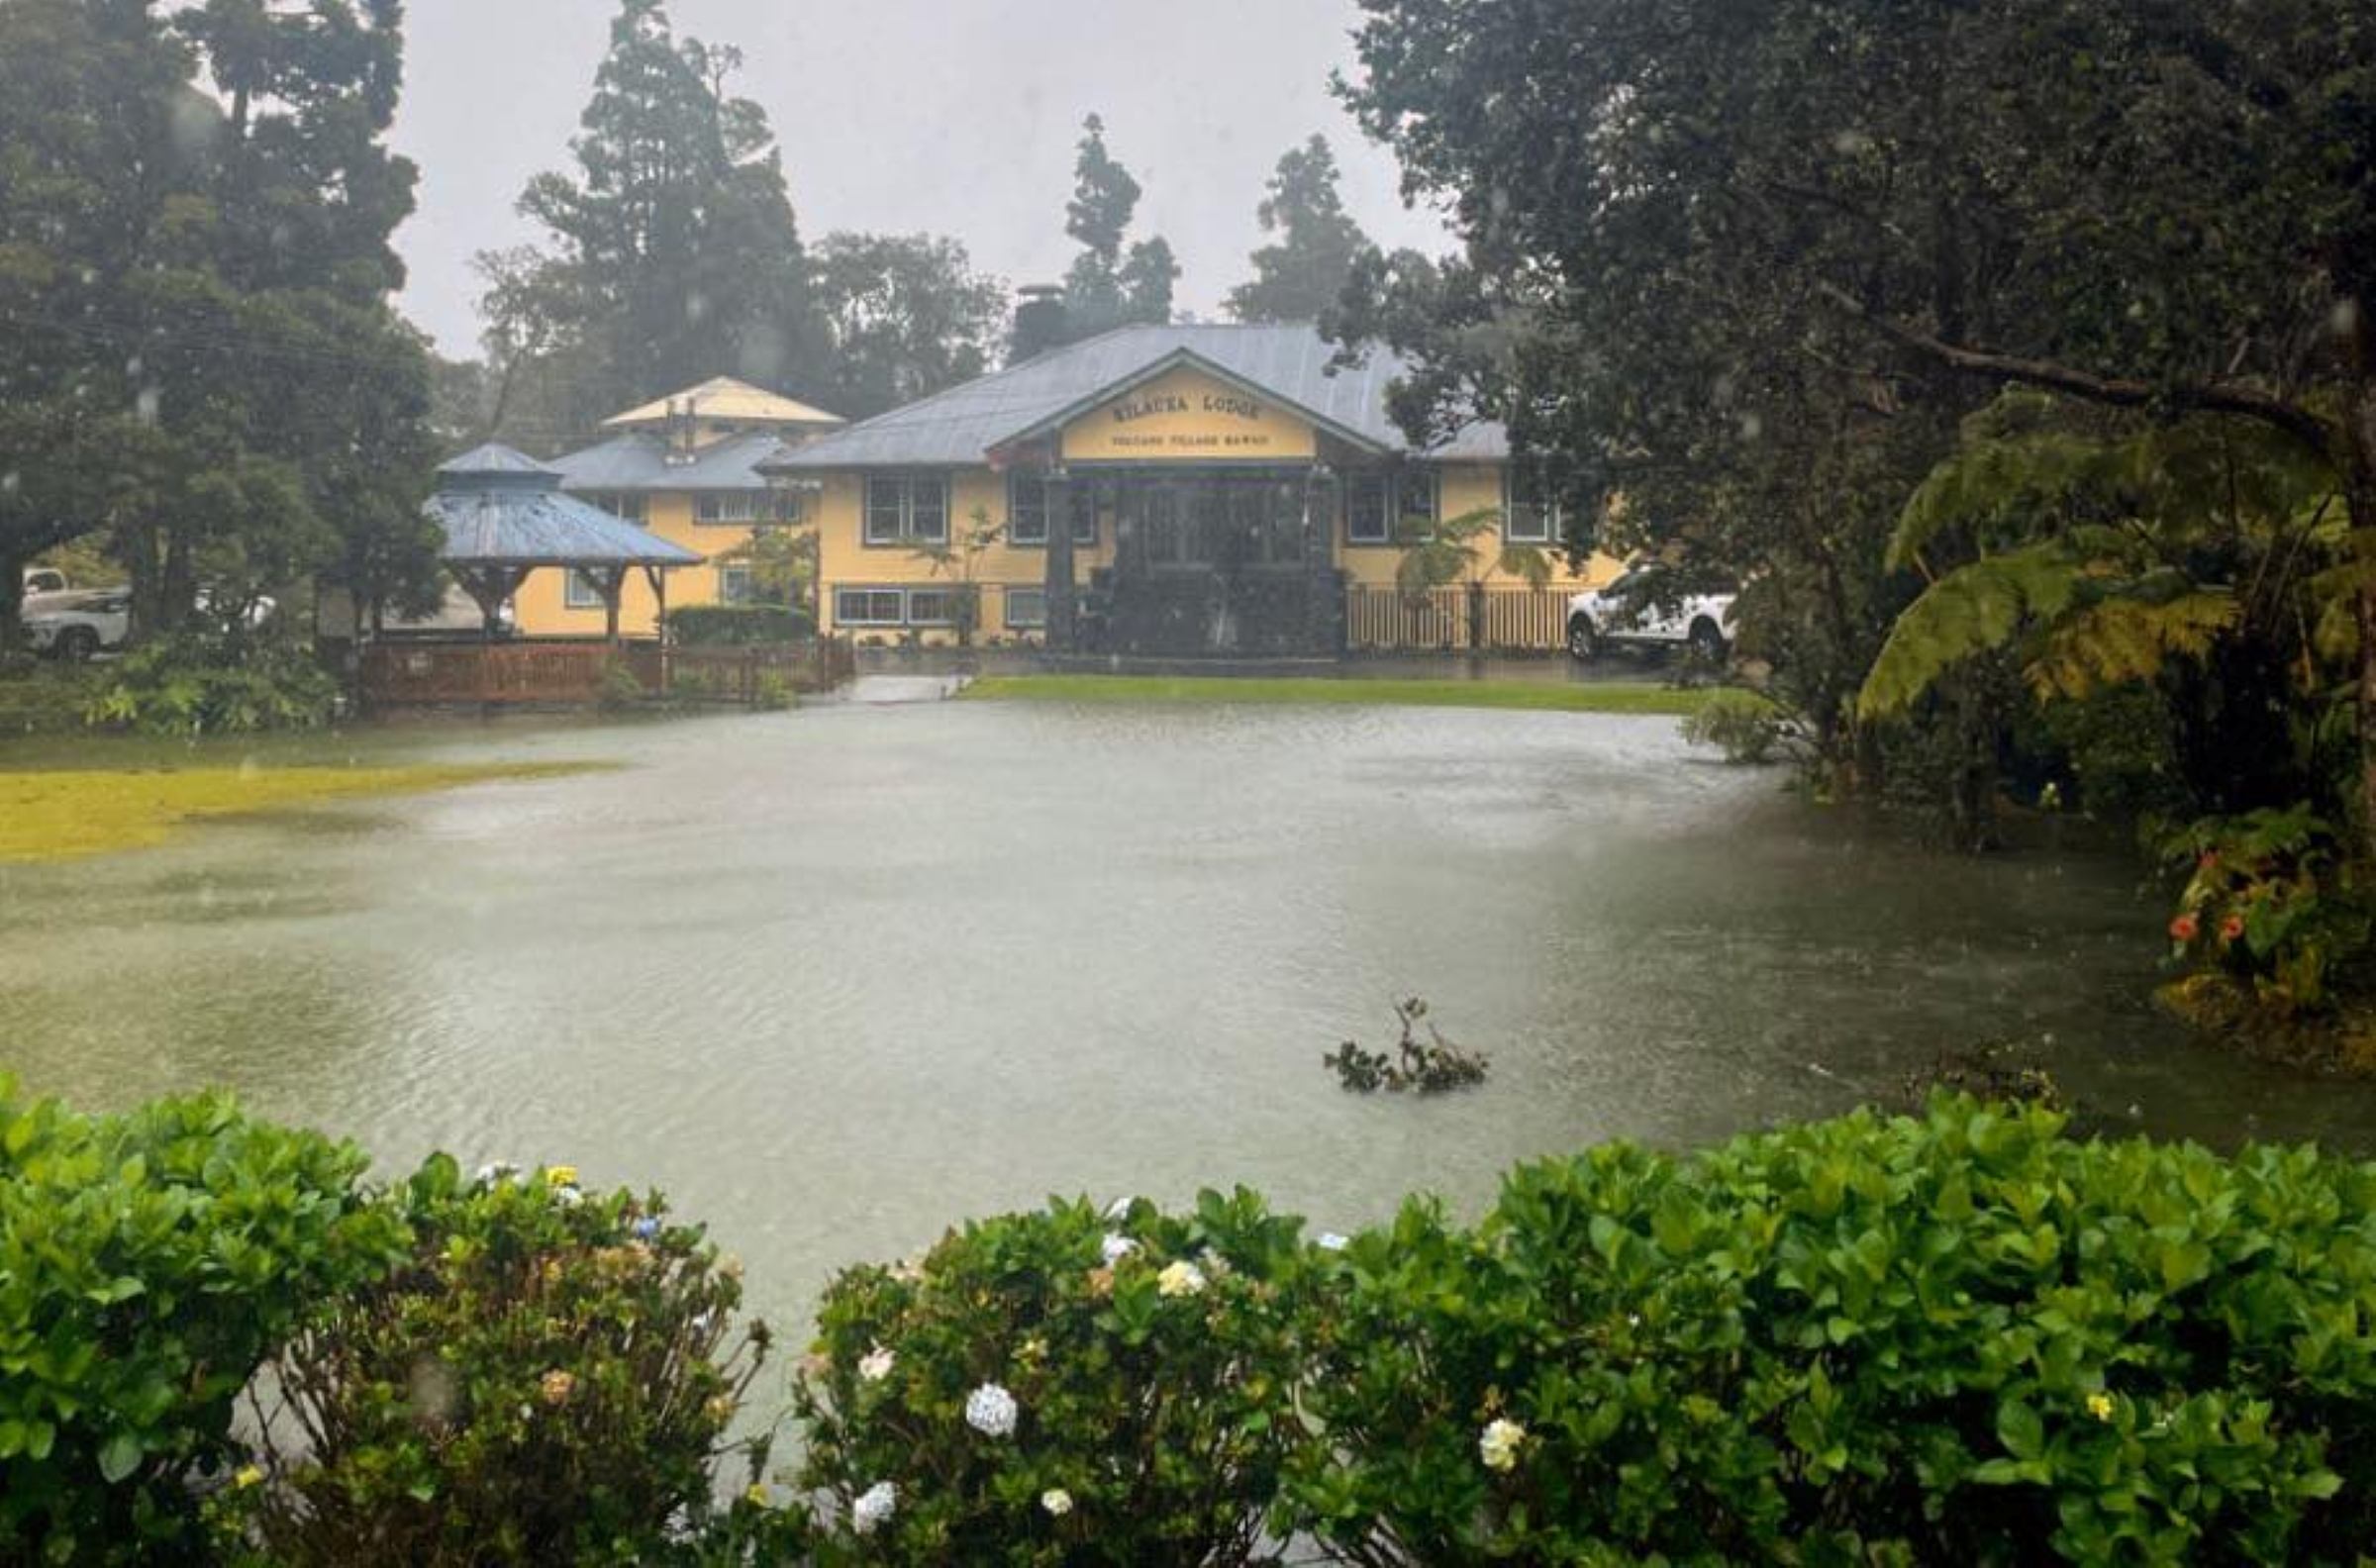
A new study by University of Hawaiʻi at Mānoa College of Tropical Agriculture and Human Resilience published in the International Journal of Climatology is the first comprehensive analysis of extreme hourly rainfall patterns throughout the islands during a 50-year period from 1966 to 2020.
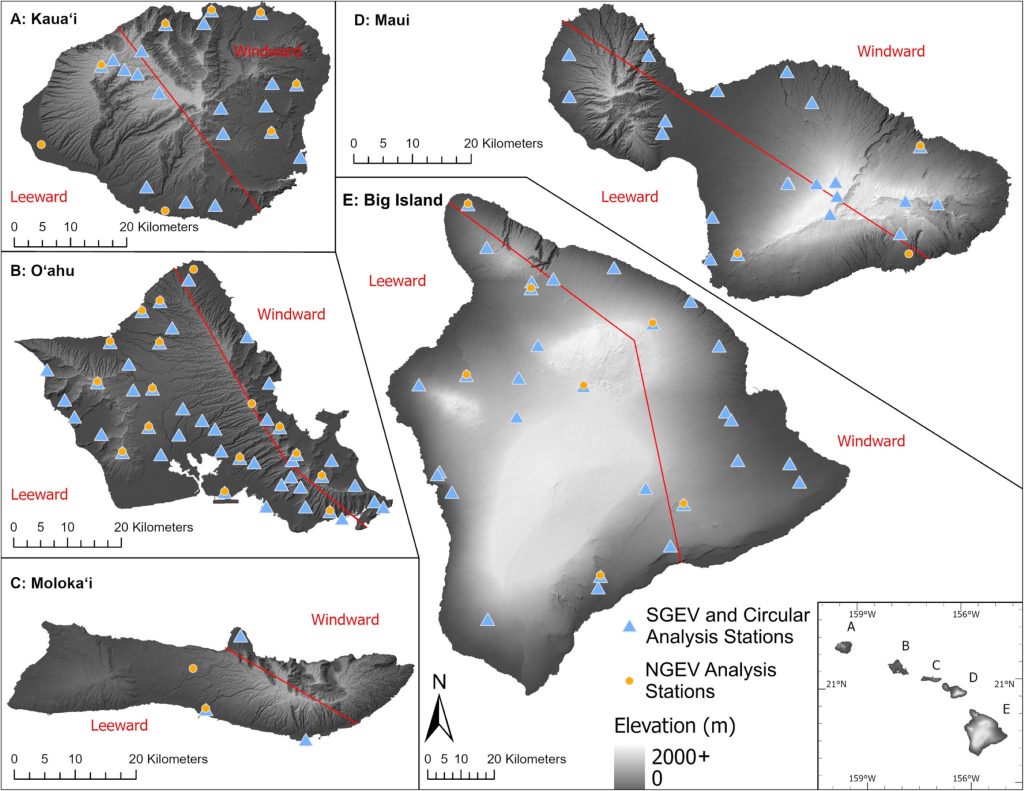
Decades of hourly data from 117 rain gauges around Kauaʻi, Oʻahu, Molokaʻi, Maui and Hawaiʻi Island uncovered climate trends that traditional 24-hour daily averages often miss.
Steep, mountain-filled tropical watersheds such as Hawaiʻi’s that can experience bursts of intense rainfall for 1 to 6 hours, overwhelming stream channels and storm drains before emergency alerts are even issued.
“If we want to understand extreme weather, like storms and floods, we really need to look at short-duration, high-temporal-resolution data rather than daily or monthly averages,” said College of Tropical Agriculture and Human Resilience Department of Natural Resources and Environmental Management professor and principal investigator in the new study Yinphan Tsang said in a university release.
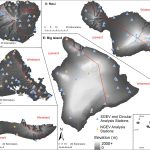
 Map of rainfall gauges used for stationary, non-stationary and circular analysis in the five Hawaiian Islands used in a new study by University of Hawaiʻi researchers. Red lines indicate the physiographic division of windward (northeast) and leeward (southwest) regions on the islands.
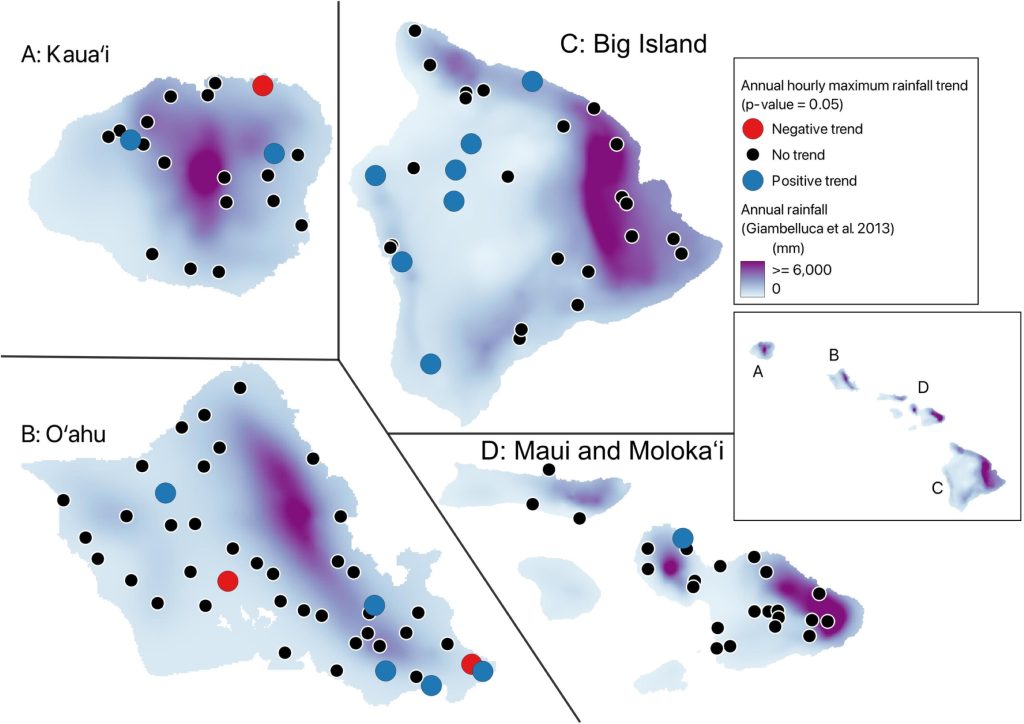
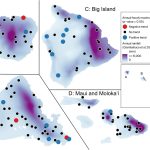
- Locations from 1990 to 2020 of rainfall gauges with positive (blue circles), negative (red circles) and no significant (black circles) trends in annual maximum hourly rainfall used in a new study by University of Hawaiʻi researchers.
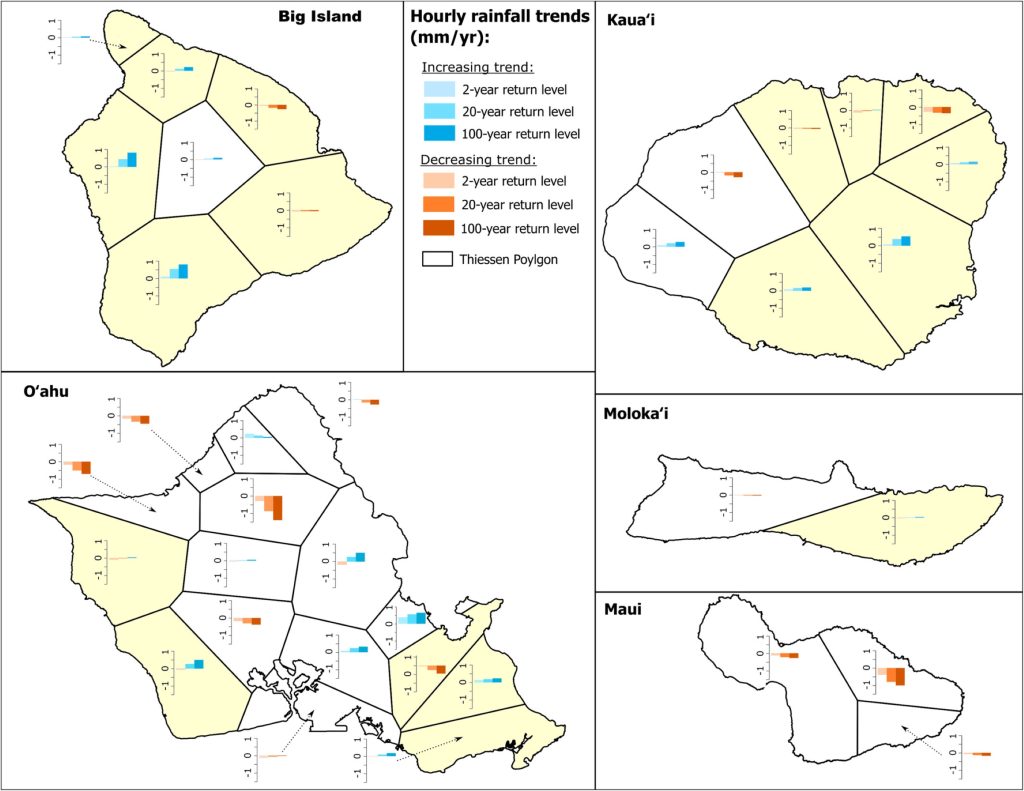
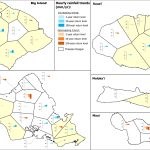
- Hourly rainfall trends of non-stationary return level estimates between 1966 and 2020 in a new study by University of Hawaiʻi researchers. Bar plots show increasing (blue) or decreasing (orange) trends with different return levels (2-year, 20-year and 100-year; from light to dark, and left to right). The affected areas of the trend are delineated. Shaded yellow polygons denote areas with opposing trend directions in different rainfall durations.
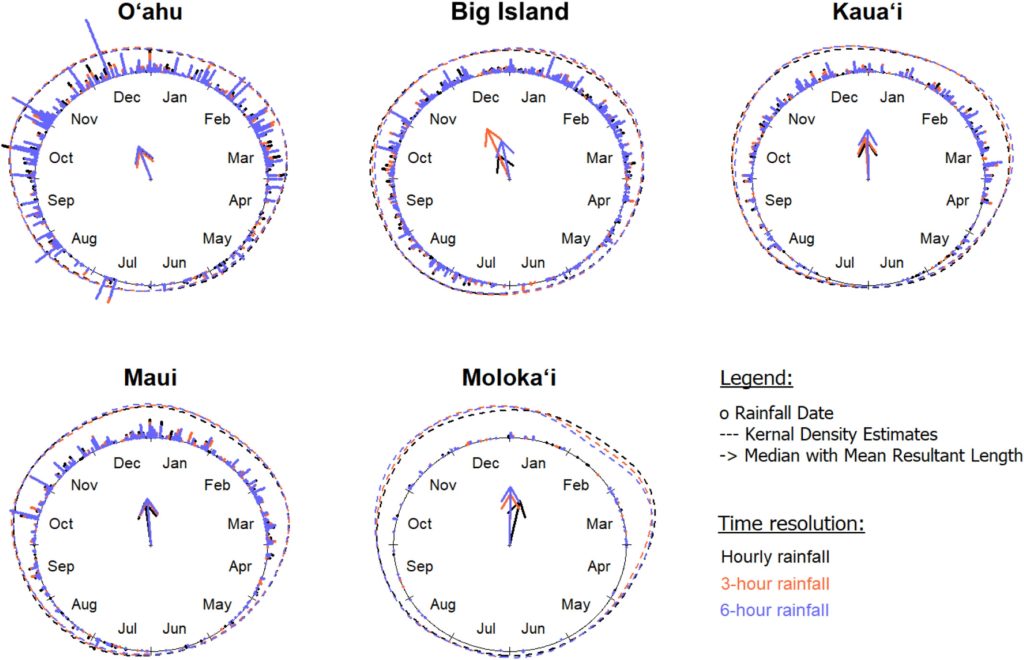
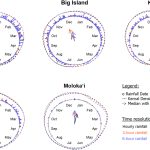
- Occurrence date of annual maximum hourly (black), 3-hour (light red) and 6-hour (purple) rainfall on Oʻahu, Big Island, Kauaʻi, Maui and Molokaʻi. The mean resultant length (indicated by the arrow length) represents the concentration of extreme rainfall occurrence dates; a value of 1 indicates all annual maxima occurred on the exact same day while a value of 0 indicates a perfectly uniform distribution throughout the year. From data in a new study by University of Hawaiʻi researchers.
The study’s major findings include:
- Common heavy rains, happening once every 2 years, are generally becoming less intense throughout the state.
- Short, sudden bursts of rain lasting 1 to 3 hours — the severe storms that usually occur only once every 20 to 100 years — are getting significantly stronger.
- Storms lasting 6 hours or longer are weakening more noticeably than shorter storms of about 3 hours.
Researchers noted that rainfall trends vary widely even between neighboring areas. Because of Hawaiʻi’s unique mountains and island terrain, rainfall intensity can increase in one neighborhood while decrease just a few miles away.
Researchers also identified two distinct peaks when Hawaiʻi is most vulnerable to extreme hourly rain events: October through December and February through March.
These heavy rains are overall driven by cold fronts, kona lows and other winter weather systems moving through the islands. The extreme events occurring from February through March, near the end of the wet season, were unexpected and could take people by surprise.
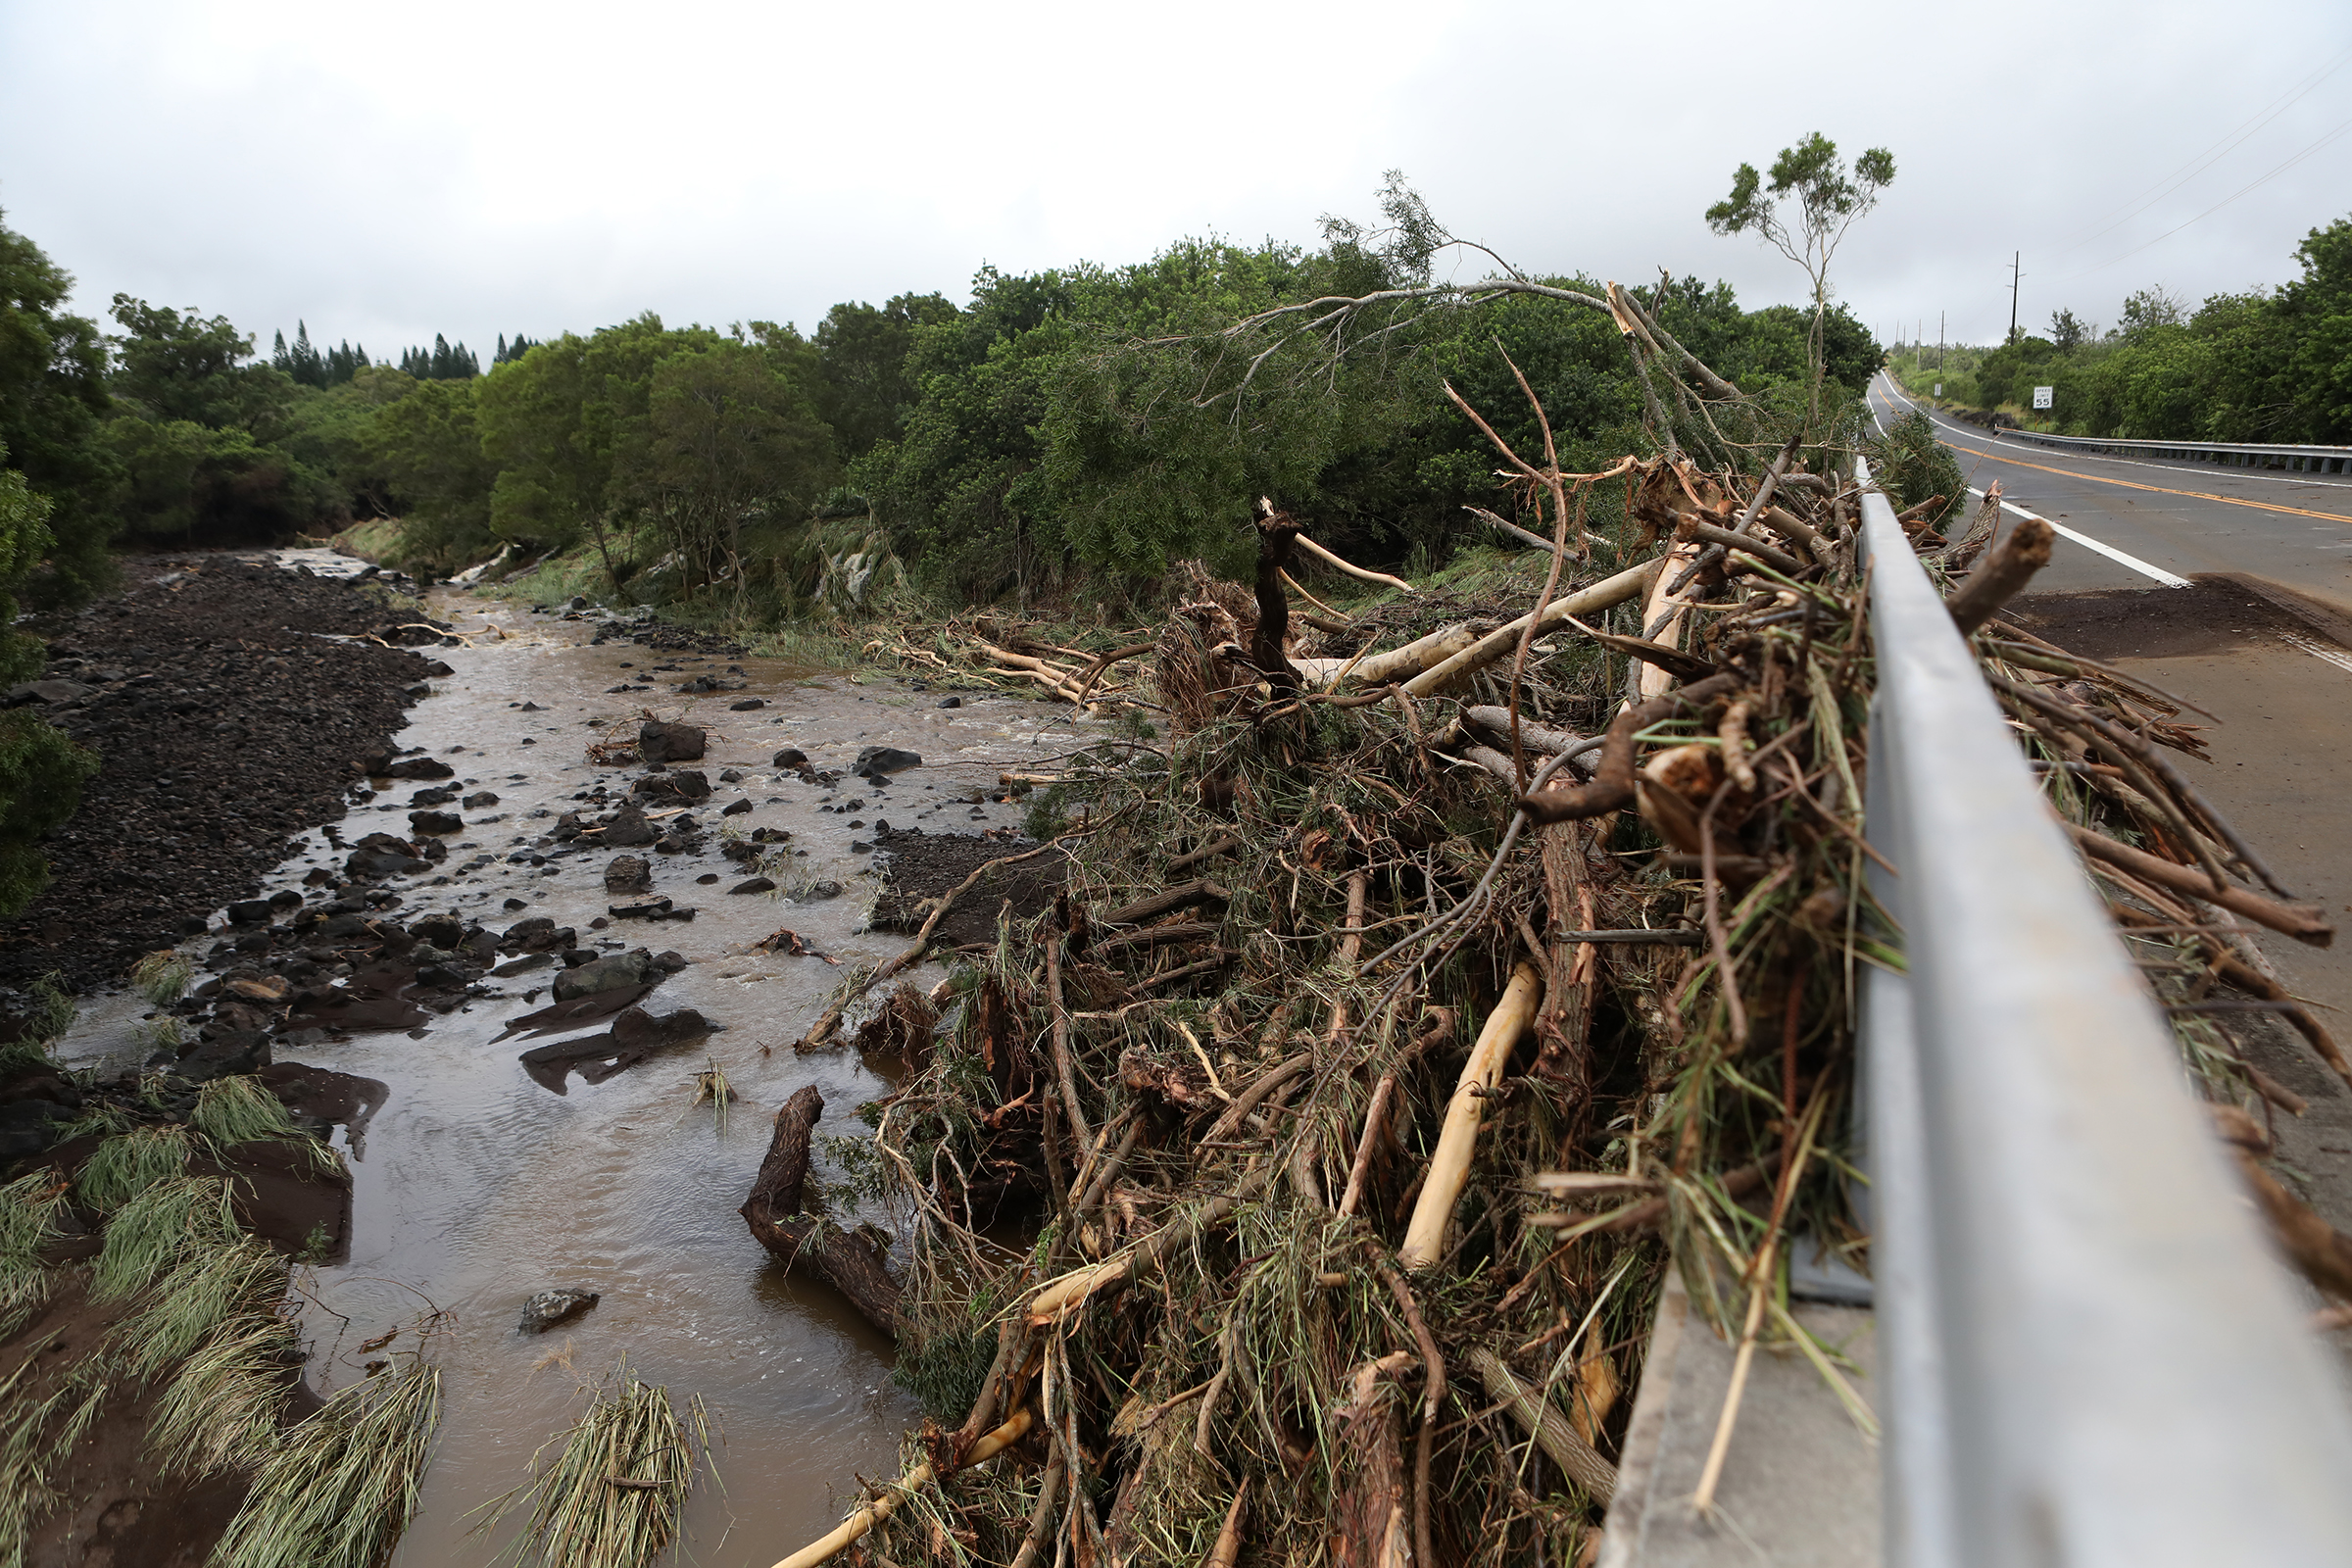
Other systems, such as tropical cyclones, could also bring extreme rainfall during the summer.
The study findings offer updates for emergency responders, county planners and infrastructure design.