

New Interactive Air Monitoring Tool Available Online
The Hawai‘i Department of Health, in partnership with the Hawai‘i County Civil Defense Agency and the U.S. Environmental Protection Agency, expanded air quality monitoring capacity in the Lower East Rift Zone during the volcanic eruption on Hawai‘i Island.
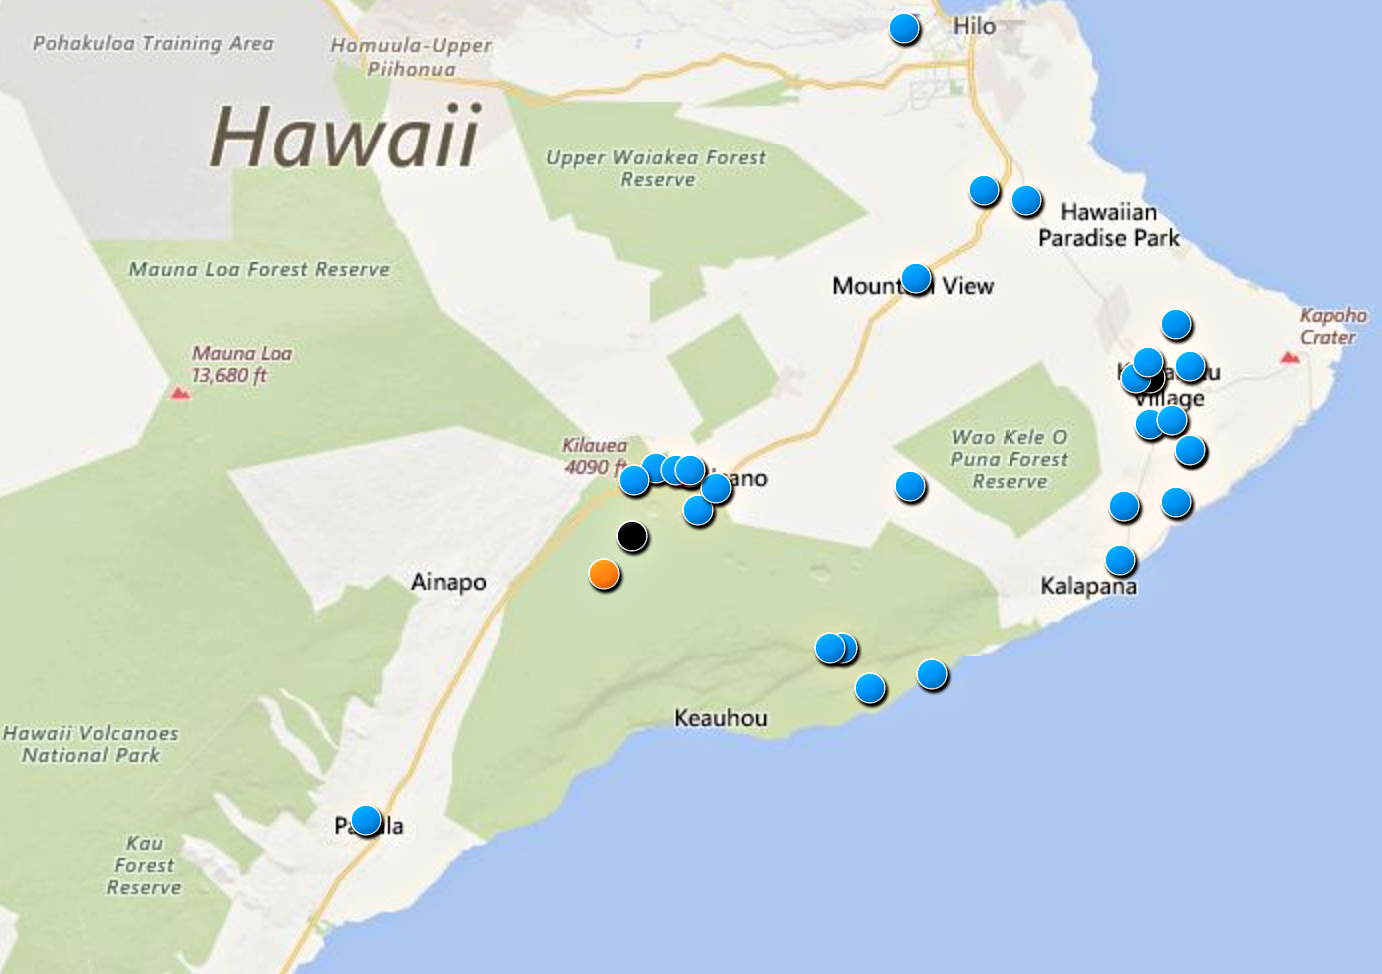
Hawai‘i Island emergency responders now have access to real-time data from more than 30 additional areas on the island to make informed decisions about the air quality affected by volcanic activity.
Data from newly installed air quality monitors stationed in the Kīlauea East Rift Zone and other affected areas is now available to the public.
The Hawai‘i Department of Health, in partnership with the Hawai‘i County Civil Defense Agency and the U.S. Environmental Protection Agency, expanded air quality monitoring capacity in the Lower East Rift Zone during the volcanic eruption on Hawai‘i Island.
The data is now available online.
“The health and safety of first responders and the community have been our top priorities,” said DOH Dr. Bruce Anderson. “These additional monitors will provide integral data for emergency management officials to make critical decisions each day to support response efforts, and for residents and visitors to make informed decisions for their personal health and safety concerns.”
“Working together with state and local public health and emergency management agencies, the EPA developed an online mapping tool that provides real-time air quality data near the volcanic activity,” said Mike Stoker, regional administrator for the EPA’s Pacific Southwest Office. “The EPA will continue to provide support to our partner agencies to ensure first responders and the public have access to this vital information.”
The map viewer uses the county’s three-color public notification system (blue, orange and red), which recommends protective actions to be taken by responders and the public. The three-color system corresponds with established health guidelines.
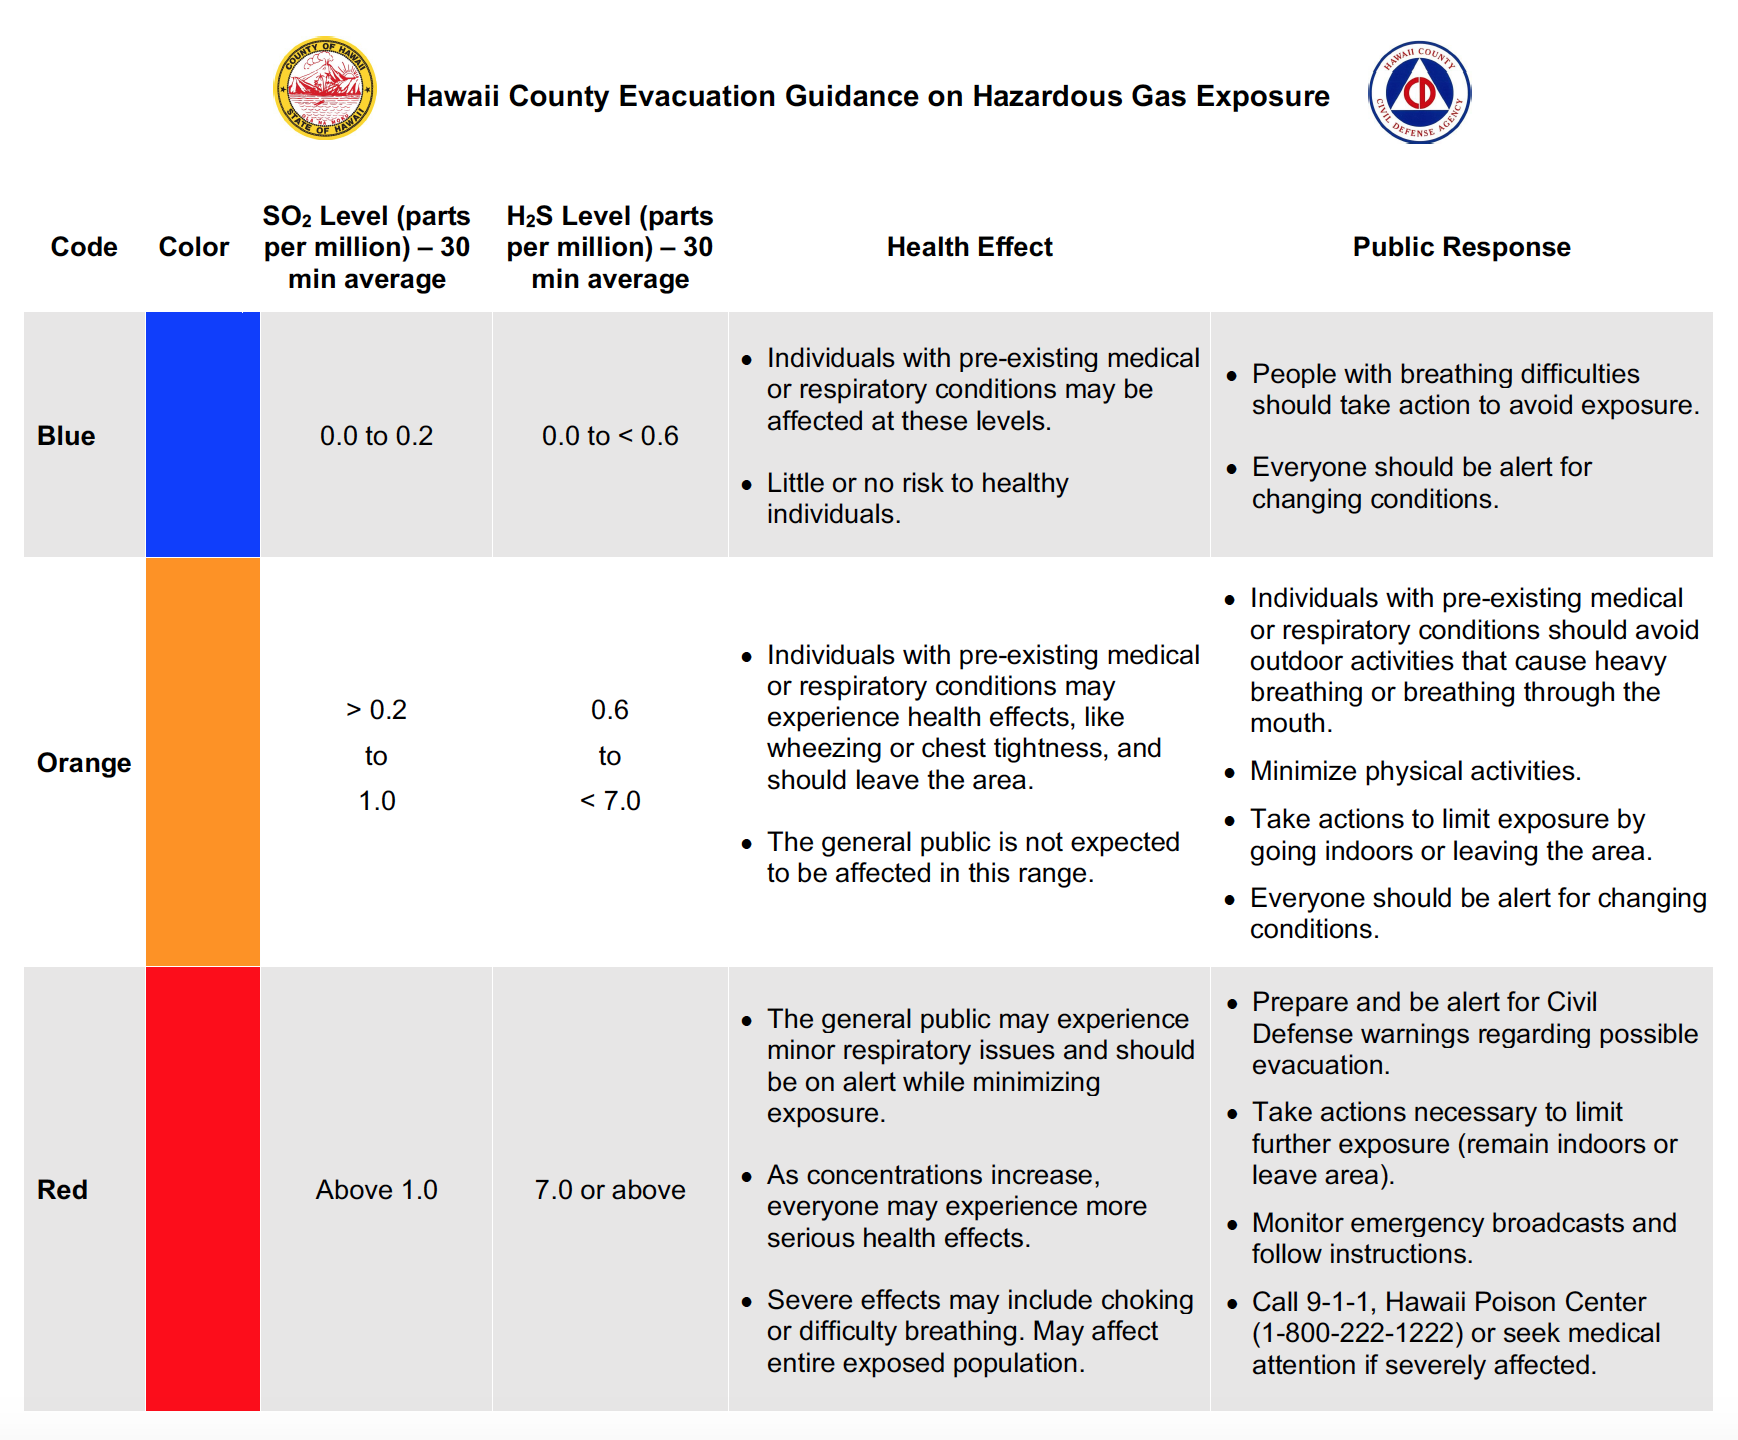
“Volcanic eruptions are unique hazards that call for specialized response protocols,” said Talmadge Magno, HCCDA administrator. “We developed a system that aligns with federal and state health standards that also meets the needs of our county first responders. We believe these guidelines support our sheltering and evacuation messaging by efficiently communicating health risks to the public during our ongoing response.”
In addition to the DOH and EPA monitors, the National Park Service, U.S. Geological Survey, and South Coast Air Quality Management District in California also provided expert staff, equipment and monitors to this network. There are 15 new monitoring stations in place, which brings the total network to 34 monitoring stations. Monitors track sulfur dioxide (SO2), hydrogen sulfide (H2S) and particulate matter. Most monitors are placed around the active fissure area, but there are also monitors in the southern and western areas of the island.
The monitors provide real-time data on SO2 and H2S levels. The public viewer shows a map of the monitoring stations color-coded based on the average concentration of all data received over 30 minutes and is updated every time a new reading is received. The color air monitoring stations will change depending on the level of health risk. Blue indicates gas levels are healthy, orange indicates moderate levels, and red indicates unhealthy conditions.
To learn more about Hawai‘i County’s evacuation guidance on hazardous gas exposure, visit http://www.hawaiicounty.gov/lava-related/#ToxicGasPolicy.
To sign up for alerts from Hawai‘i County, visit https://countyofhawaii.bbcportal.com/.
All alerts are posted at http://www.hawaiicounty.gov/active-alerts.
Additional county resources are available at http://www.hawaiicounty.gov/lava-related/.
In addition to existing real-time and historic air quality data, the new SO2 and H2S data can be accessed on the Interagency Vog Dashboard at https://vog.ivhhn.org/current-air-quality or by going directly to www.epa.gov/kilaueaairdata.
Sponsored Content


