Volcano Watch — On the road again: Chasing Mauna Loa’s gas plume
Volcano Watch is a weekly article and activity update written by scientists and affiliates with the U.S. Geological Survey Hawaiian Volcano Observatory.

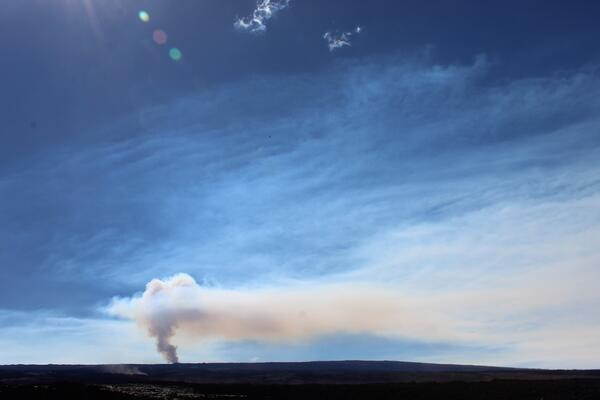
When Mauna Loa erupted in November 2022 for the first time in 38 years, one of the main concerns was the lava and where it would flow. But Mauna Loa didn’t only erupt lava – as with all other volcanic eruptions, many tonnes of volcanic gases were emitted from the active vents.
Volcanic gases emitted during eruptions include water vapor, carbon dioxide (CO2) and sulfur dioxide (SO2). During eruptions, the Hawaiian Volcano Observatory aims to characterize both the chemistry and amount of gas being emitted.
Sulfur dioxide emission rates are a key parameter to measure because they can be used as a proxy for lava effusion rate and they dictate how much vog, or volcanic air pollution, there is downwind. Typically, we measure sulfur dioxide emission rates using a vehicle-mounted ultraviolet spectrometer, which we drive beneath the plume.
At Kīlauea, because the trade winds tend to blow the summit plume in a single direction, we have a permanent array of spectrometers to measure sulfur dioxide there, so we don’t have to do as much driving.
Driving on Chain of Craters Road for the Puʻuʻōʻō eruption and on Highway 130 for the 2018 lower East Rift Zone eruption were our common means of measuring the plume in the trade wind direction for these other Kīlauea eruptive sites.
Mauna Loa, however, is at such a high altitude compared to Kīlauea and experiences different wind patterns. Winds were very variable during the eruption. Sometimes measurements of high-altitude plumes can be made relatively easily by flying an airplane or a helicopter beneath the plume instead of driving. But the Mauna Loa plume had not only high concentrations of gases, but also contained particles, like Pele’s hair, which could adversely affect an aircraft flying under it.
So what did that mean for the Hawaiian Volcano Observatory gas crew during the eruption? We had to shift gears and do a whole lot of driving!
Over the course of the roughly two-week eruption, the winds took the plume in many directions, including over Saddle Road, Ocean View, Pāhala, Puna, Hilo, Kailua-Kona and Captain Cook. This meant that the gas team drove nearly 3,000 miles. Ultimately, all the driving paid off and we succeeded in measuring emission rates on 10 days. This allowed the Hawaiian Volcano Observatory to report these emission rates to the public and to vog forecasters during the eruption.

Preliminary data processing suggests that Mauna Loa emitted more than two million tonnes (2 Mt) of sulfur dioxide between Nov. 28 and Dec. 12. This doesn’t include a large volume of sulfur dioxide that satellite images show was emitted with the initial fissure opening overnight between Nov. 27 and 28; we need ultraviolet light to make these driving measurements, which means they can only be conducted during daylight hours.
Daily emission rates are estimated to have ranged from 200,000 to 500,000 t/d of sulfur dioxide early in the eruption and were just over 100,000 t/d later in the eruption. By Dec. 8, emissions had dropped significantly to only about 30,000 t/d. Only about 2,000 t/d were emitted on Dec. 10, and by Dec. 12, emissions were essentially not detectable, even on the ground near the Fissure 3 cone.
These emission rates are very similar to those measured during the 2018 lower East Rift Zone eruption at Kīlauea, which also emitted sulfur dioxide at a rate of nearly 200,000 t/d for a portion of the eruption. The total sulfur dioxide emitted by the 2018 eruption was roughly five times more than Mauna Loa’s total, however, owing in part to the longer eruption duration.
Sulfur dioxide emission rates reported for the 1984 eruption of Mauna Loa were roughly 100,000 to 200,000 t/d, as derived from satellite data. However, the technology used at the time was not as sophisticated as our modern spectrometers and likely underestimated those emission rates. So Mauna Loa’s 1984 sulfur dioxide emissions were probably similar to those in 2022.
Sulfur dioxide emission rates at Mauna Loa’s Fissure 3 are down to nearly zero with the eruption being over. Mauna Loa will eventually erupt again and when it does, Hawaiian Volcano Observatory’s gas team will be in the driver’s seat, ready to do whatever it takes to measure emission rates.
Sponsored Content
Comments


_1770333123096.webp)


