What’s That (Seismic) Noise?
Volcano Watch is a weekly article and activity update written by U.S. Geological Survey Hawaiian Volcano Observatory scientists and affiliates.
The USGS Hawaiian Volcano Observatory (HVO) uses dozens of seismometers to locate individual earthquakes and identify signals that are related to faulting and magma movement within our volcanoes.
Seismometers also record vibrations caused by a variety of other sources. Signals generated by seismic noise vary greatly in intensity, duration, and source type. Some are easily identifiable while others remain a mystery. Each region in the world has a different selection of seismic noise depending on its geologic setting, cultural activities, and weather.
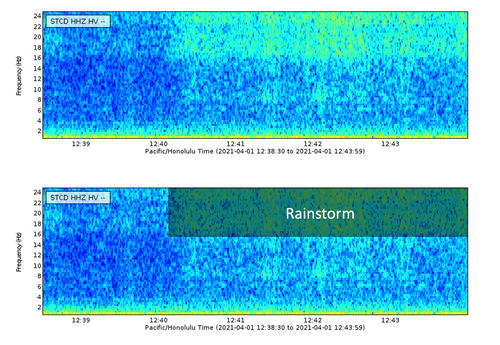
In today’s article, we’ll describe some of the more interesting sources of seismic noise that HVO seismologists see on a fairly regular basis. The following figures are called spectrograms. These plots can be a useful addition to the squiggly lines (or waveforms) that one typically associates with earthquakes because they allow the observer to easily identify complex or even multiple signals. Time is displayed on the horizontal axis, signal frequency is displayed on the vertical axis, and signal intensity is shown in color. The warmer the color, the stronger the signal is at that specific time and frequency.

(Public domain.)
Unsurprisingly, a common source of noise in HVO’s seismic record is bad weather. This is particularly true along Kīlauea’s East Rift Zone. Noise from wind and rain is characterized by its diffuse mid- to high-frequency content. In this specific example, the station starts to record an approaching rainstorm just after 12:40 p.m. HST. Since heavy rain and wind can last for days at a time, these signals tend to be pretty persistent.
If an analyst ever has any doubt over whether the signals they’re observing are actually weather, a quick peek at one of the webcams (https://www.usgs.gov/volcanoes/kilauea/webcams) overlooking Ahuʻailāʻau, Puʻuʻōʻō, or Halemaʻumaʻu will quickly confirm their suspicions.

(Public domain.)
This spectrogram shows not one but two commonly observed signals. The most noticeable is the set of ribbon-like lines across the top of the spectrogram. This undulating, high-frequency feature is a helicopter flying near the seismic station, likely carrying HVO staff monitoring the ongoing eruption in Halemaʻumaʻu at Kīlauea’s summit. It is sometimes possible for seismologists to determine the path of a helicopter by tracking it as it passes over multiple stations.
Speaking of the recent eruption, the steady low-frequency signal seen on the bottom of this spectrogram as a yellow-orange band is the eruptive tremor that started shortly after lava broke the surface in Halemaʻumaʻu on the night of December 20, 2020. Since then, nearly all stations in the vicinity of the newly formed lava lake at Kīlauea’s summit have been recording this continuous signal.

(Public domain.)
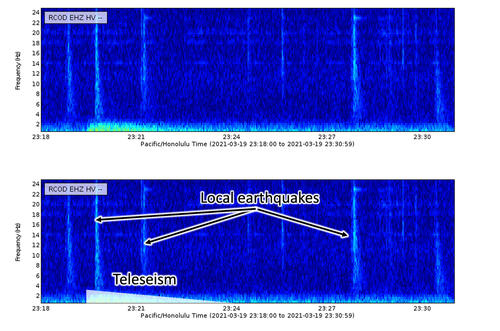
Teleseisms are earthquakes observed from at least 1000 km (620 miles) away. By the time teleseisms reach very distant stations, all but the lowest frequencies have been lost. The low-frequency signal starting around 11:19 p.m. HST in this March 19 spectrogram is a teleseism from the magnitude-7.0 earthquake that struck near Ishinomaki, Japan last month (https://earthquake.usgs.gov/earthquakes/eventpage/us7000dl6y/executive). For comparison, the broad-frequency “spikes” appearing as lighter-colored vertical lines seen throughout this spectrogram are small local earthquakes.
HVO seismologists use the National Earthquake Information Center’s Latest Earthquakes list (https://www.usgs.gov/natural-hazards/earthquake-hazards/earthquakes) along with travel time curves (https://www.usgs.gov/natural-hazards/earthquake-hazards/science/earthquake-travel-times?qt-science_center_objects=0#qt-science_center_objects) to help differentiate between teleseisms and local low-frequency events like tremor that might indicate a change or increase in volcanic activity.

(Public domain.)
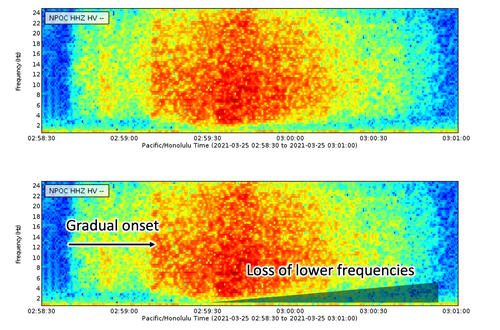
Rockfalls have a broad frequency content and gradual onset. These types of events can last for minutes at a time. One trick seismologists use to identify rockfalls is to look for the slight decrease in low frequency content as the event progresses. This feature appears as a shallow ramp on the March 25 spectrogram starting at 2:59 a.m. HST. The majority of recent rockfalls observed by HVO seismologists have been on Puʻuʻōʻō, some of which have been preceded by helicopters flying near (or perhaps even into!) the cinder cone.
Around the world, seismographs have been used to document events such as impending hurricanes, whale songs, fans celebrating during big football games, and even nuclear testing. Here in Hawaiʻi, weather, local air traffic, eruptive tremor, and rockfalls are a few of the interesting seismic signals that HVO seismologists can see while monitoring earthquake activity at our active volcanoes.
April is Tsunami Awareness Month in Hawai‘i. For information about tsunami preparedness and safety, please visit these websites: TsunamiZone, International Tsunami Information Center, National Weather Service TsunamiReady, and Hawaii Energency Management Agency.
Volcano Activity Updates
Kīlauea Volcano is erupting. Its USGS Volcano Alert level is at WATCH (https://www.usgs.gov/natural-hazards/volcano-hazards/about-alert-levels). Kīlauea updates are issued daily.
Lava activity is confined to Halemaʻumaʻu with lava erupting from a vent on the northwest side of the crater. Laser rangefinder measurements this morning, April 8, indicate that the lava in the western (active) portion of the lake is 225 m (738 ft) deep, with the eastern portion of the lava lake solidified at the surface. The summit tiltmeters recorded minor change over the past 24 hours. Sulfur dioxide emission rates measured on April 7 were 900 t/d. Seismicity remains stable, with elevated tremor. For the most current information on the eruption, see https://www.usgs.gov/volcanoes/kilauea/current-eruption.
Mauna Loa is not erupting and remains at Volcano Alert Level ADVISORY. This alert level does not mean that an eruption is imminent or that progression to an eruption from the current level of unrest is certain. Mauna Loa updates are issued weekly.
This past week, about 134 small-magnitude earthquakes were recorded beneath the upper-elevations of Mauna Loa; most of these occurred at depths of less than 8 kilometers (about 5 miles). Global Positioning System (GPS) measurements have recently shown a change to contraction at the summit which is most likely due to deflation of the shallow summit reservoir. Gas concentrations and fumarole temperatures at both the summit and at Sulphur Cone on the Southwest Rift Zone remain stable. Webcams show no changes to the landscape. For more information on current monitoring of Mauna Loa Volcano, see: https://www.usgs.gov/volcanoes/mauna-loa/monitoring.
There were 4 events with 3 or more felt reports in the Hawaiian Islands during the past week: a M1.9 earthquake 3 km (1 mi) ENE of Pāhala at 34 km (21 mi) depth on April 03 at 11:19 a.m. HST, a M4.3 earthquake 5 km (3 mi) NW of Pāhala at 7 km (4 mi) depth on April 03 at 11:15 a.m. HST, a M3.9 earthquake 5 km (3 mi) NNW of Pāhala at 8 km (5 mi) depth on April 03 at 11:01 a.m. HST, and a M3.2 earthquake 7 km (4 mi) W of Pāhala at 9 km (5 mi) depth on April 01 at 7:53 a.m. HST.
HVO continues to closely monitor both Kīlauea’s ongoing eruption and Mauna Loa for any signs of increased activity.
Please visit HVO’s website for past Volcano Watch articles, Kīlauea and Mauna Loa updates, volcano photos, maps, recent earthquake info, and more. Email questions to askHVO@usgs.gov.
Volcano Watch is a weekly article and activity update written by U.S. Geological Survey Hawaiian Volcano Observatory scientists and affiliates.
Sponsored Content
Comments


_1770333123096.webp)


