

VOLCANO UPDATE: Lava Advances Over Pulama Pali

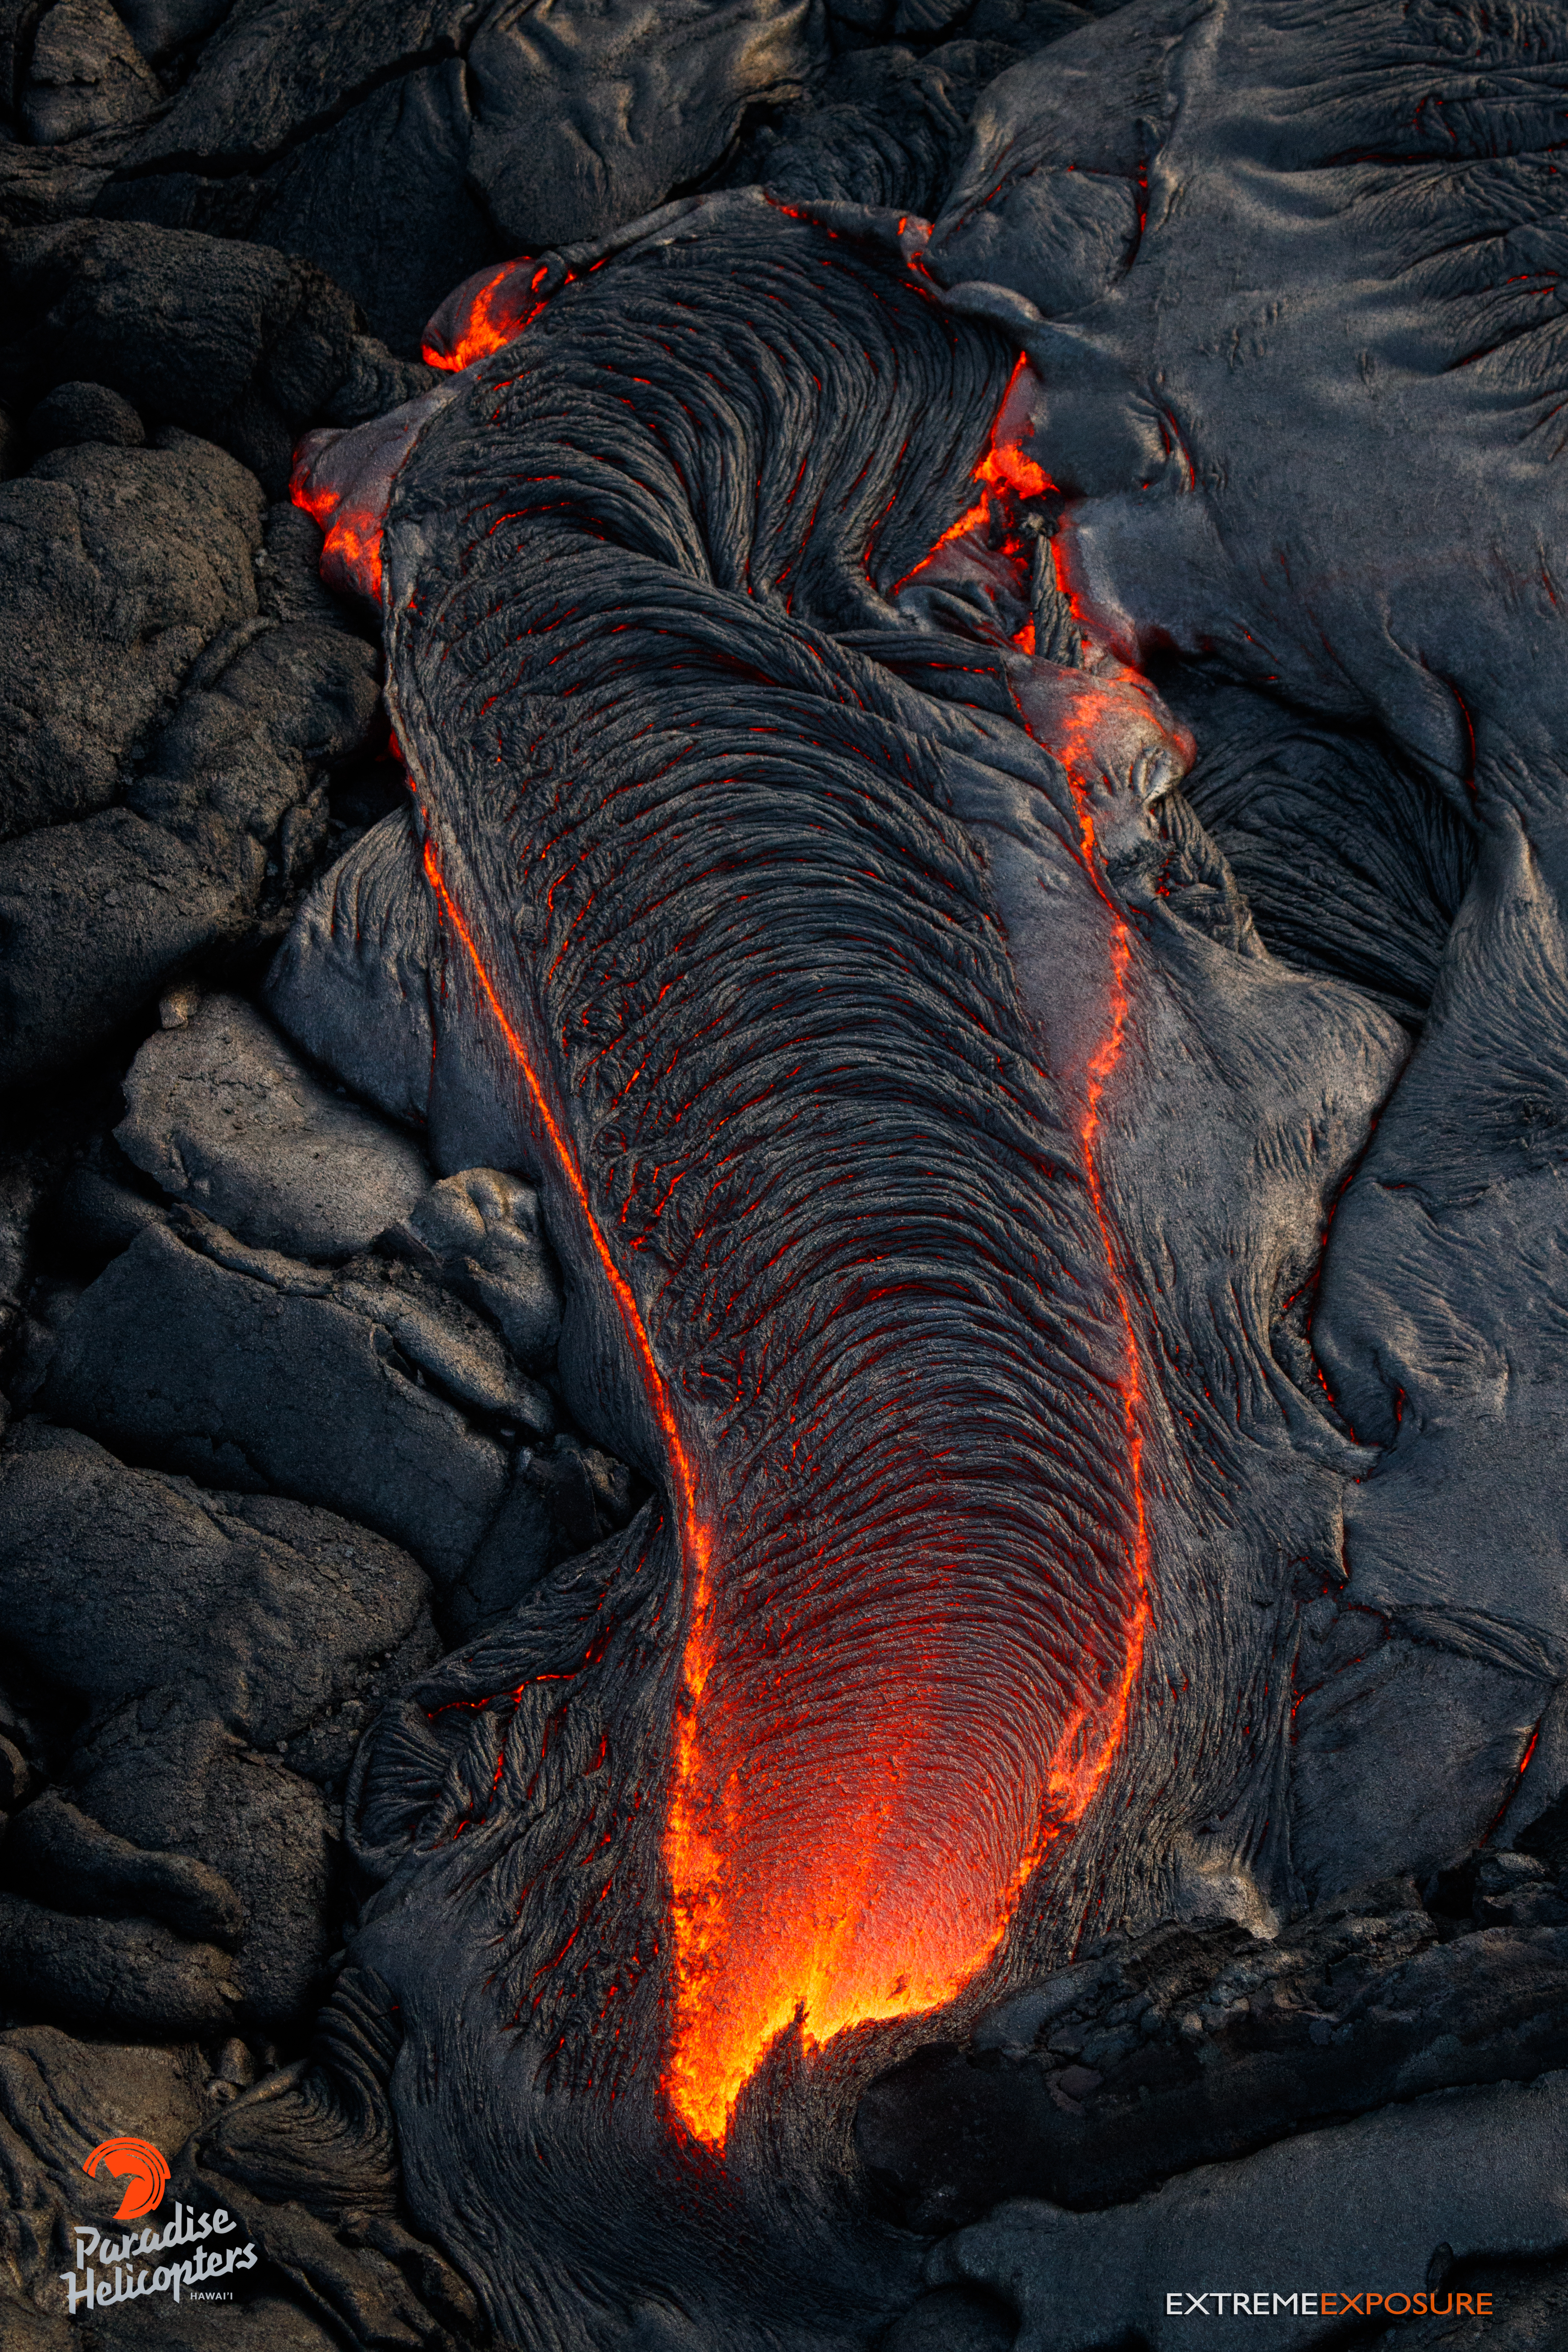
Paradise Helicopters photo, June 27, 2016.
According to a Hawaiian Volcano Observatory update issued on Monday, June 27, at 6:52 a.m., the active lava flow southeast of Puʻu ʻŌʻō continues to advance and spread, still posing no threat to nearby communities.
A satellite image from Friday, June 24, showed that the flow was 5.2 km (3.2 miles) long, and a small area of the flow front had entered the northern portion of the abandoned Royal Gardens subdivision.
Paradise Helicopters reports today that the flow has now gone past the Pulama Pali and is headed towards the ocean.
https://www.youtube.com/watch?v=xW_zOOBTR4k&feature=youtu.be
Lava has made significant progression toward the ocean this past week, and has advanced over the pali (cliff scarp) near the abandoned Royal Gardens subdivision, Mick Kalber, Paradise Helicopters’ videographer and owner of Tropical Visions, reported on Tuesday, June 28, 2016, after a sweep of the area.
This new flow is over three miles long, and has descended Pulama Pali, he said.
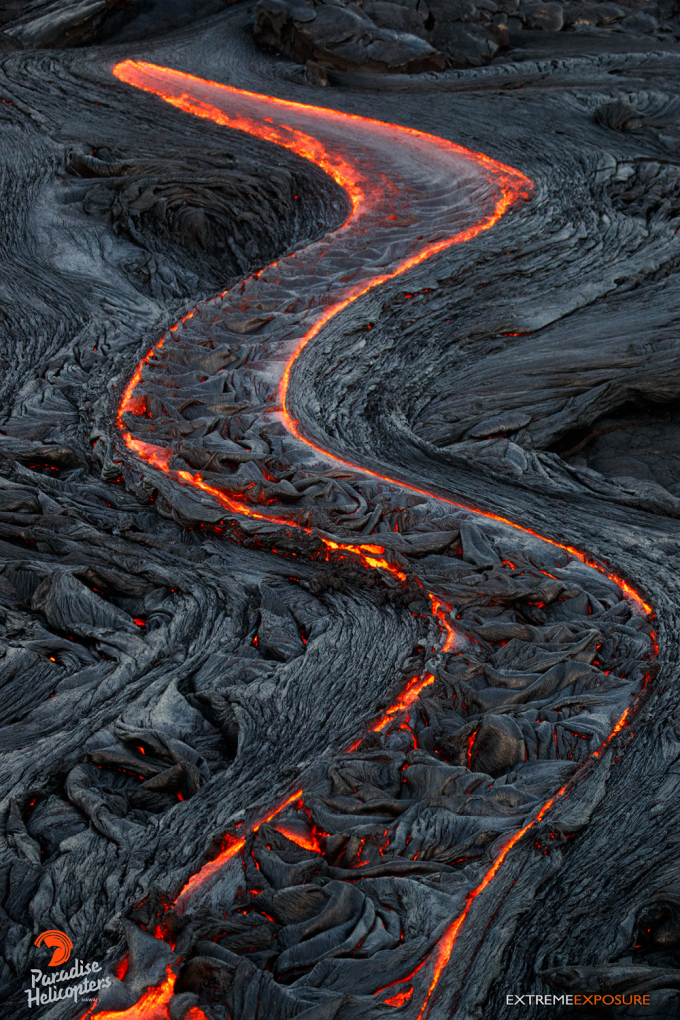
Lava has dotted the mountain with numerous outbreaks, which are overplating the flow field, and covering older pahoehoe and ‘a‘a flows.
The multitude of flows are also expanding the margins of the flow field.
“The lava that has made its way over the pali and continues on to the coast, will most likely consolidate into fewer tubes, and develop a more established delivery system,” said Kalber.
Click on photos and maps below to enlarge them.
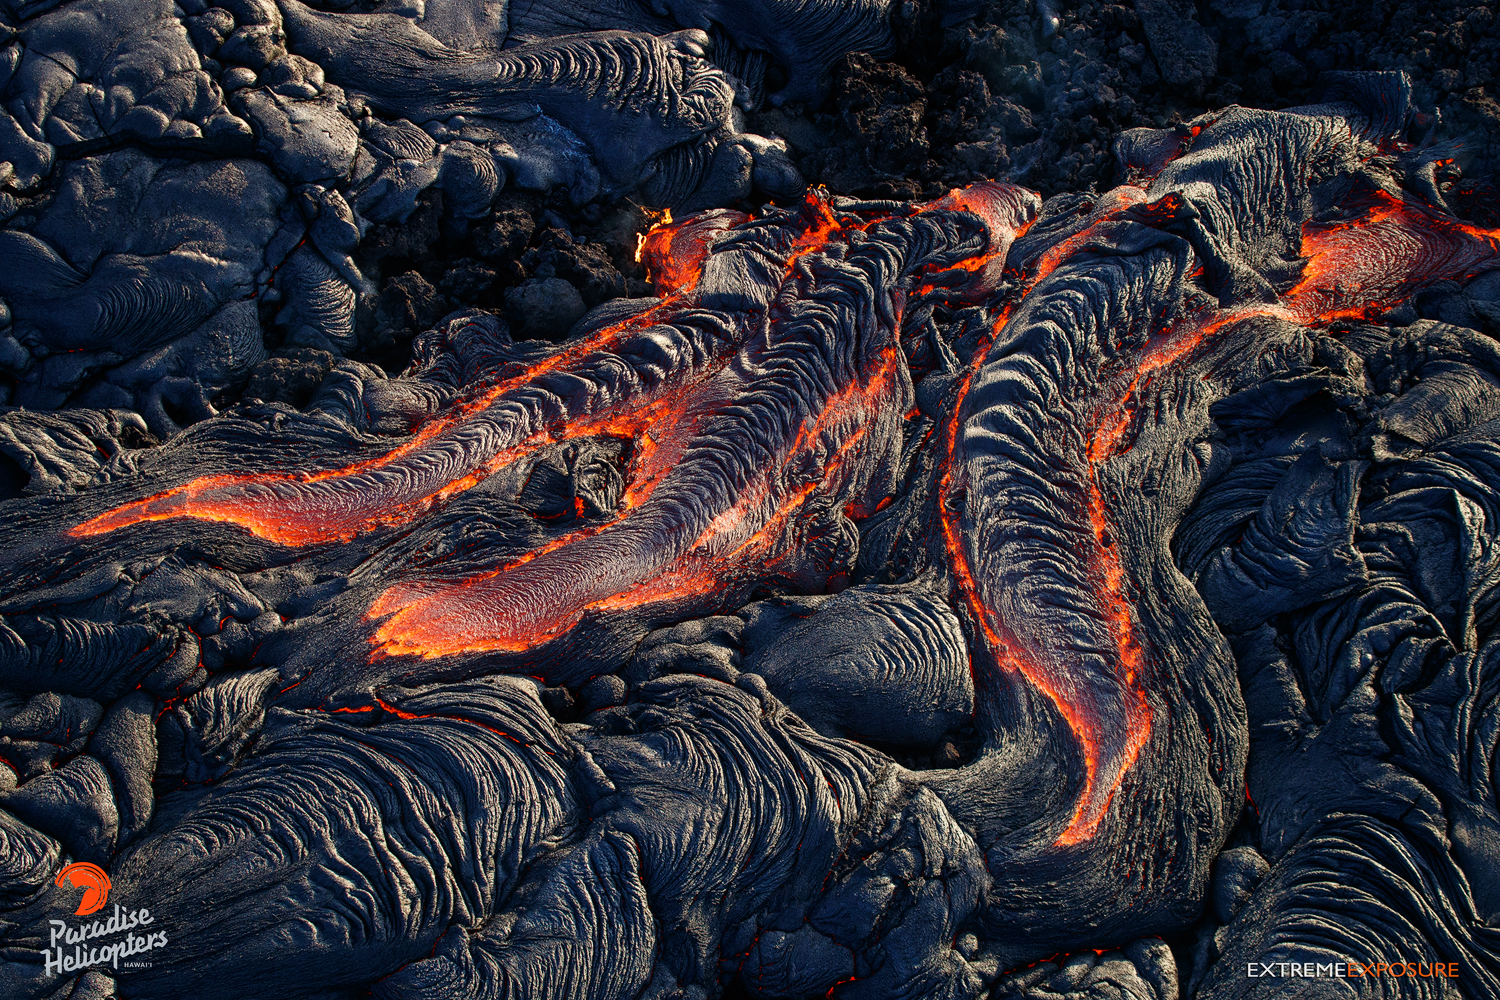
There is a tremendous amount of lava being supplied to the flow, as evidenced by the skylights near the vent, Kalber observed.
“Interestingly, the most lava we’ve seen in quite some time appeared in a huge skylight to the northeast, said Kalber. “This skylight shows a river of lava rushing by, some 30 to 40 feet or more below the surface.
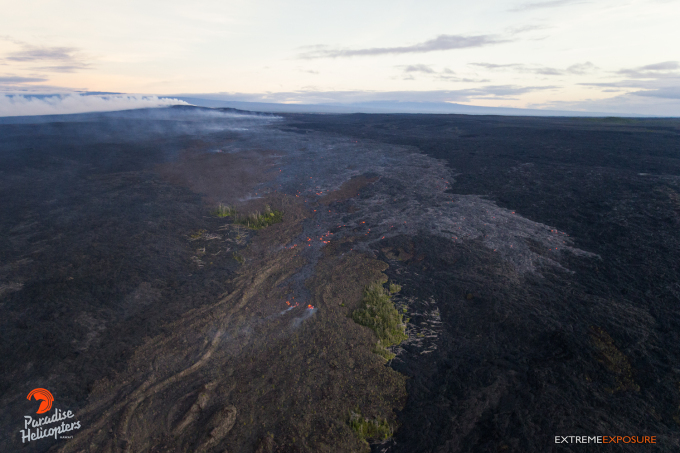
“We were able to access the Puʻu ʻŌʻō, vent, but could not see the lava lake on the west end due to its heavy plume and steam,” Kalber said. “Thankfully, residents of the communities to the north and east can continue to rest easy, as Pele’s lava continues moving away from their homes.”
HVO reports that bright incandescence is visible in the overnight webcam views of the active lava flow field, marking lava tube skylights and scattered breakouts near the flow front.
The lava lake at Halemaʻumaʻu Crater continues to circulate and spatter, and the lake level has been relatively steady over the past day.
Low rates of seismicity are observed across the volcano, and long-term deformation trends show continued inflation beneath the summit and uppermost Southwest Rift Zone.
Gentle inflationary tilt continues at the summit. The summit lava lake at Halemaʻumaʻu continues to circulate and spatter. On Monday morning, the lake surface is roughly 27 m (90 feet) below the adjacent crater floor, and spattering in the lake was visible from HVO.
Low rates of seismicity in the summit caldera region are noted, with minor fluctuations in seismic tremor related to variations in lava lake circulation and spattering.
Sulfur dioxide emissions from the summit vent over the past week ranged from 3,500 to 7,000 metric tons per day.
HVO webcams show several incandescent vents on the floor of Puʻu ʻŌʻō crater, as usual. Tilt has been affected by recent rainfall. There are no significant changes in seismic activity at Puʻu ʻŌʻō.
Sulfur dioxide emission rate from all East Rift Zone vents when last measured on June 22 was about 350 metric tons/day.
Paradise Helicopters photo, June 27, 2016.
Paradise Helicopters photo, June 27, 2016.
Paradise Helicopters photo, June 27, 2016.
Paradise Helicopters photo, June 27, 2016.
Paradise Helicopters photo, June 27, 2016.
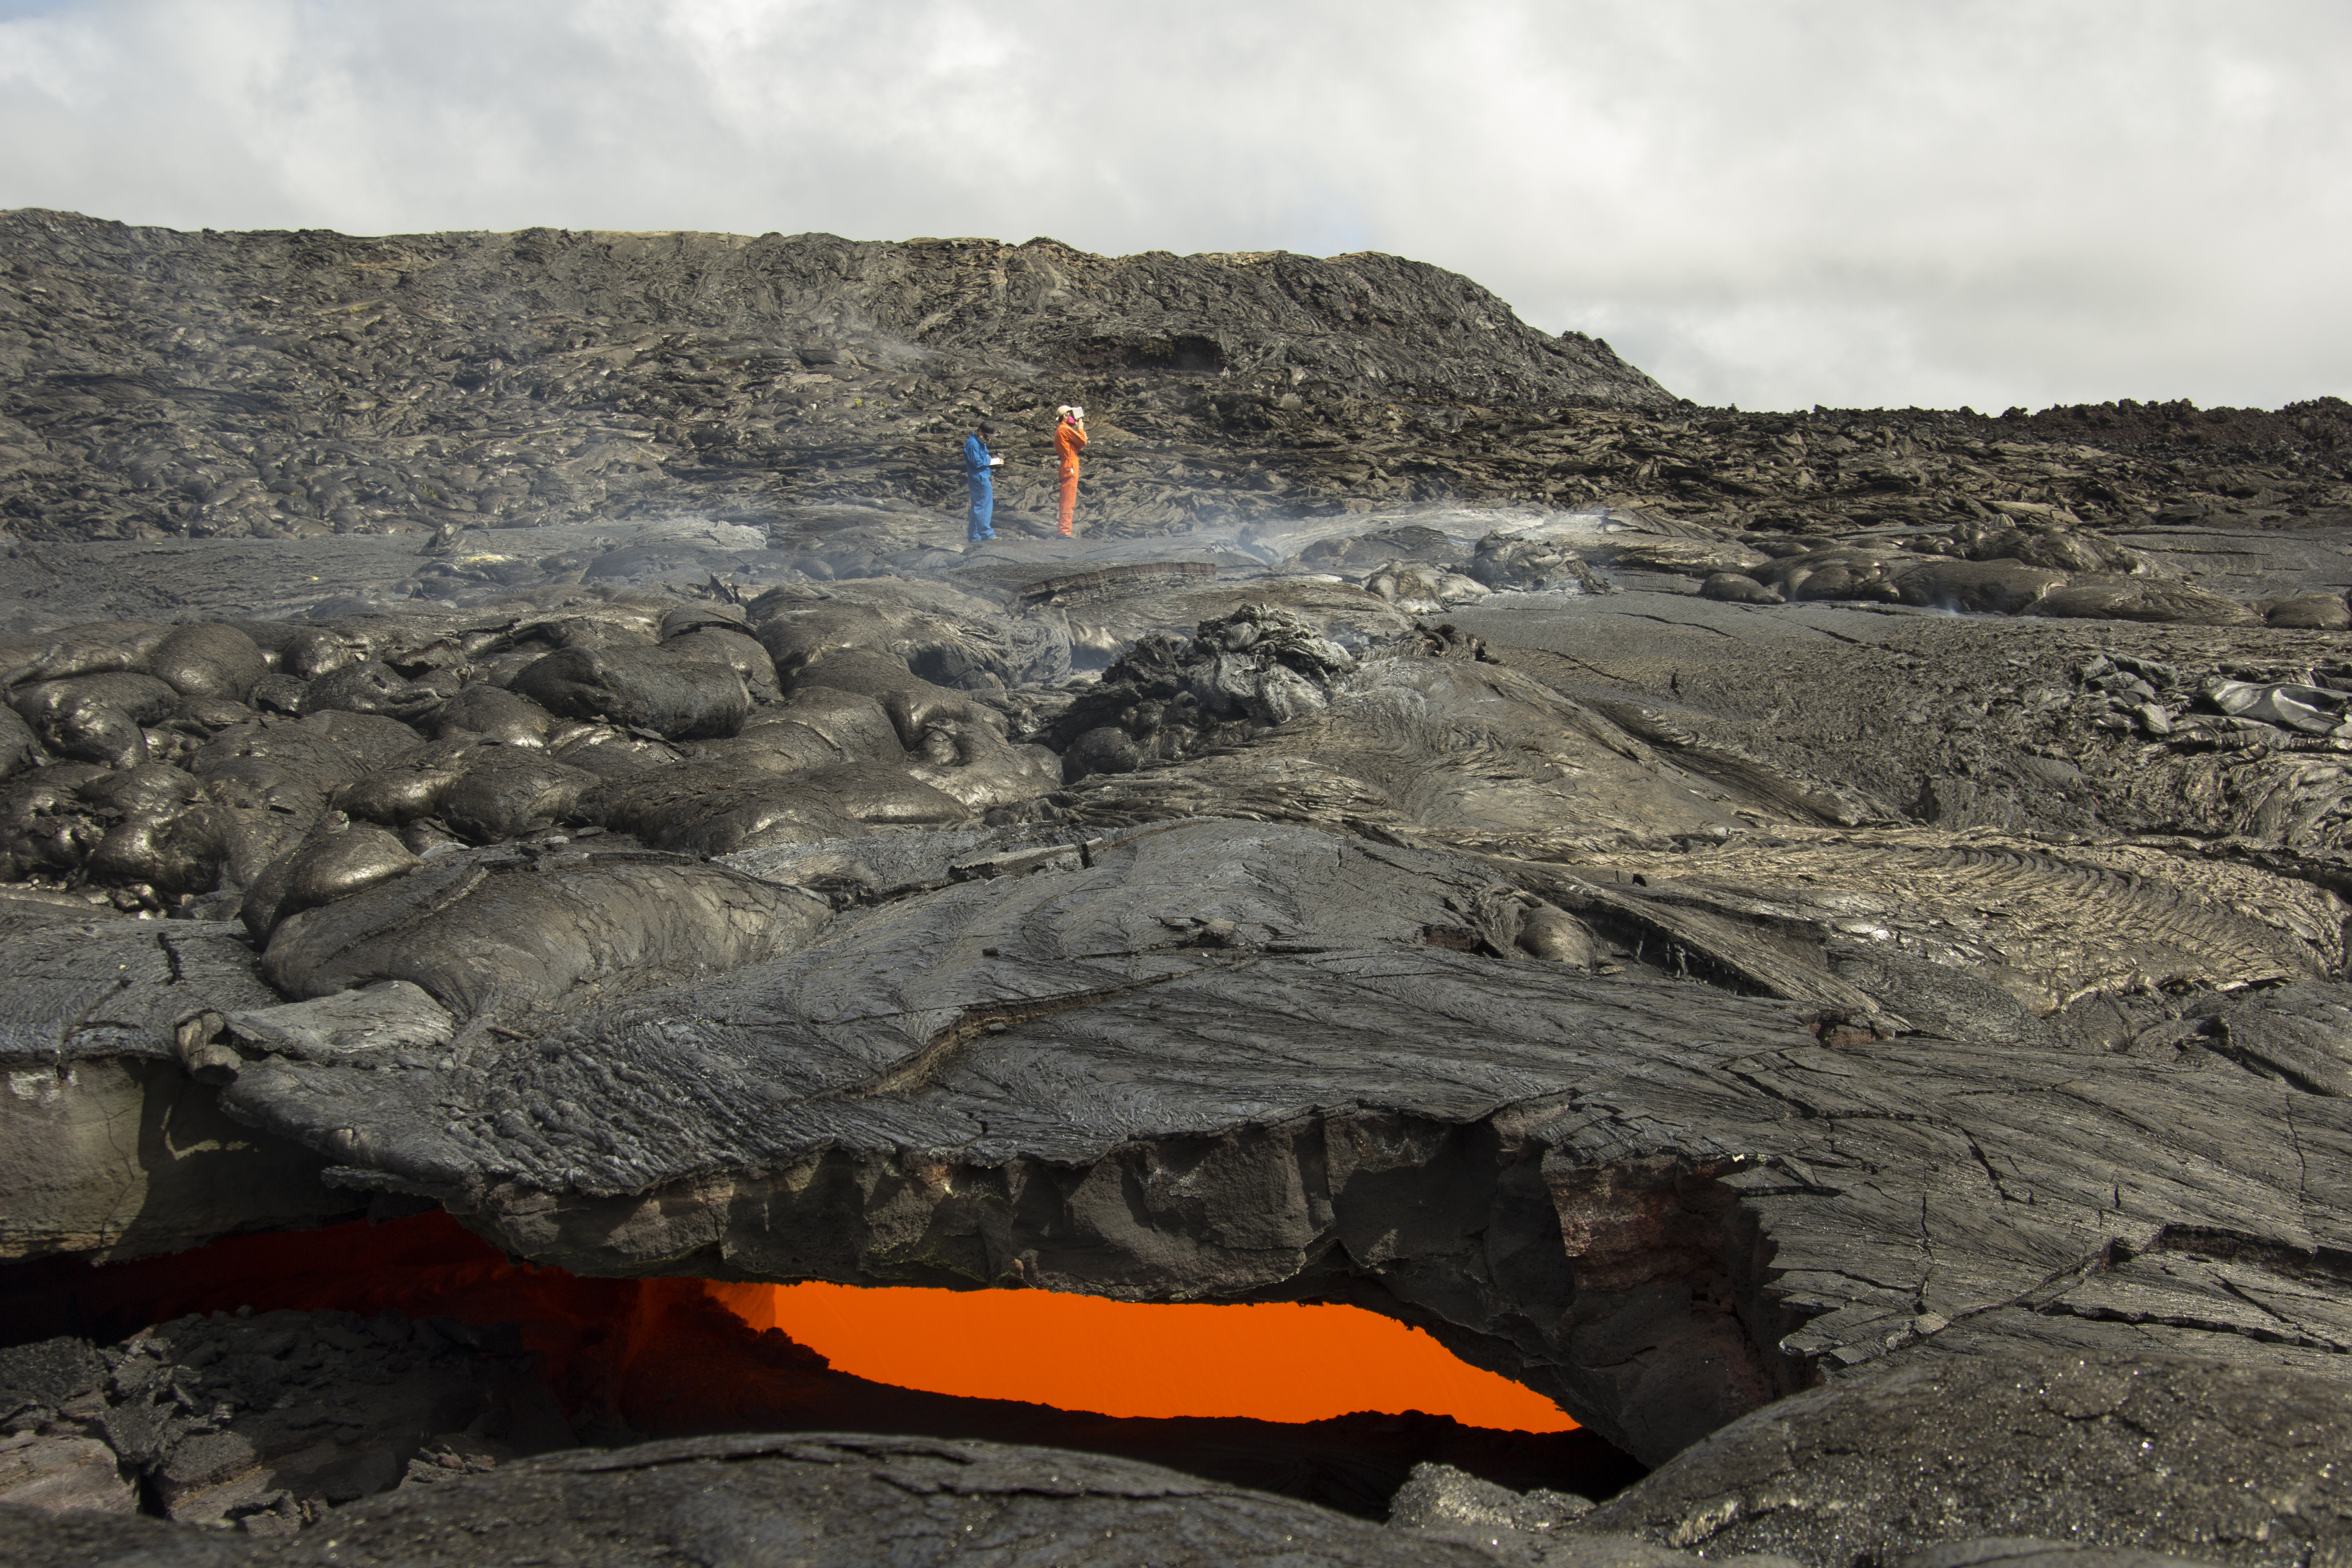
HVO geologists conduct a VLF (very low frequency) survey across the episode 61g lava tube to measure the depth and cross-sectional area of lava flowing within the tube. June 23, 2016, HVO photo.
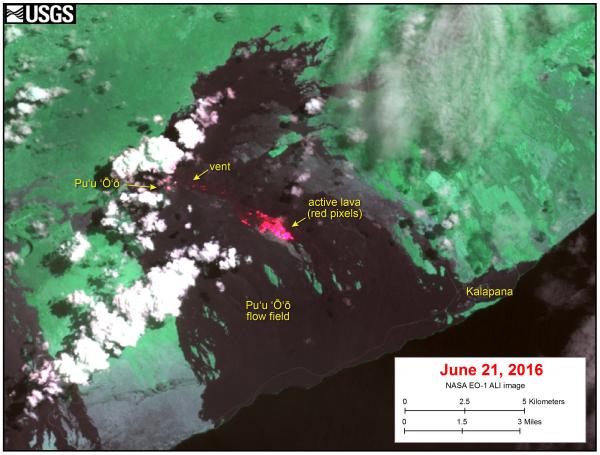
This satellite image was captured on June 21 by the Advanced Land Imager instrument onboard NASA’s Earth Observing 1 satellite. The image is provided courtesy of NASA’s Jet Propulsion Laboratory. Although this is a false-color image, the color map has been chosen to mimic what the human eye would expect to see. Bright red pixels depict areas of very high temperatures and show active lava. White areas are clouds. The image shows continued advancement of the flow towards the southeast. Active surface breakouts, shown by red pixels, are limited to the area of the flow front. Lava tubes beneath the surface supply lava to these breakouts from the vent. June 21, 2016, NASA image.

This satellite image was captured on Monday, June 27, by the Advanced Land Imager instrument onboard NASA’s Earth Observing 1 satellite. The image is provided courtesy of NASA’s Jet Propulsion Laboratory. Although this is a false-color image, the color map has been chosen to mimic what the human eye would expect to see. Bright red pixels depict areas of very high temperatures and show active lava. White areas are clouds. The image shows continued advancement of the flow towards the southeast. The flow front is progressing down the pali, along the western portion of the abandoned Royal Gardens subdivision and along the eastern boundary of Hawaiʻi Volcanoes National Park. Over the past few days, the flow has moved at a rate of about 300 meters per day .2 miles per day—an increase over the rate last week and likely due to the steeper slope on the pali.
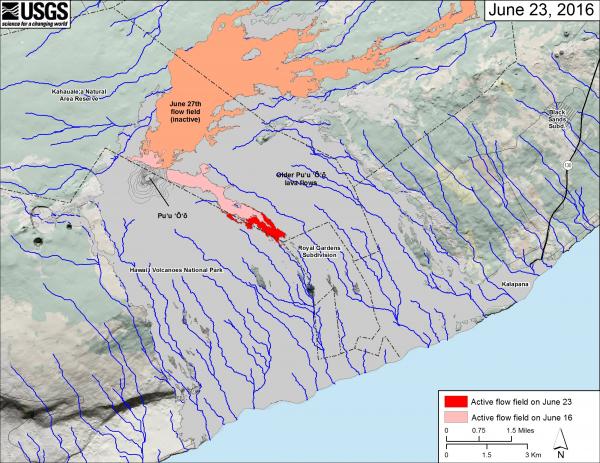
This small-scale map shows Kīlauea’s active East Rift Zone lava flow field in relation to the southeastern part of the Island of Hawaiʻi. The area of the active flow field on June 16 is shown in pink, while widening and advancement of the active flow field as mapped on June 23 is shown in red. The area covered by the inactive June 27 flow is shown in orange. The Puʻu ʻŌʻō lava flows erupted prior to June 27, 2014, are shown in gray. The blue lines over the Puʻu ʻŌʻō flow field are steepest-descent paths calculated from a 2013 digital elevation model (DEM), while the blue lines on the rest of the map are steepest-descent paths calculated from a 1983 DEM. Steepest-descent path analysis is based on the assumption that the DEM perfectly represents the Earth’s surface. DEMs, however, are not perfect, so the blue lines on this map can be used to infer only approximate flow paths. The base map is a partly transparent 1:24,000-scale USGS digital topographic map draped over a 1983 10-m digital elevation model (DEM). HVO image.
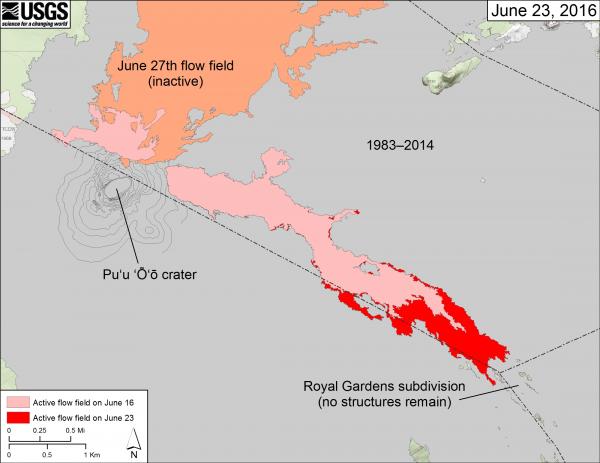
This map shows recent changes to Kīlauea’s active East Rift Zone lava flow field. The areas covered by the recent breakouts at Puʻu ʻŌʻō as of June 16 are shown in pink, while widening and advancement of the active flow as mapped on June 23 is shown in red. The area covered by the inactive June 27th flow is shown in orange. Puʻu ʻŌʻō lava flows erupted prior to June 27, 2014, are shown in gray. HVO image.
Sponsored Content


