

East Hawai‘i Real Estate Sales Volume Balloons
By Nate Gaddis, Hilo Brokers Ltd.
If you’ve noticed a bit of extra pep in your Realtor’s step lately, or an extra tooth or two showing when they grin, you’re probably not imagining things.
The Big Island is currently in the midst of its hottest real estate market since the rainbows-and-unicorns era of 2006-07.
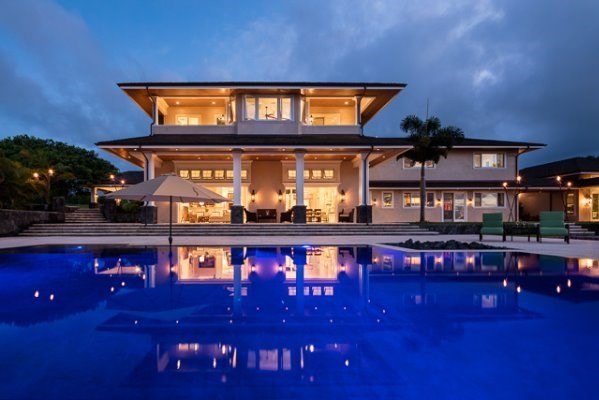
East Hawai‘i sales volume has surged since 2014. Courtesy of Hank Correa, Hank Correa Realty. Image source: Ethan Tweedie Photography
As noted in an earlier article on Big Island price trends, “Big Island Real Estate Prices Near Record High,” home values here have been on a serious upswing lately.
Although both homeowners and their agents do a little happy dance every time housing prices go up, there’s another measure of market performance that is highly informative and has the power to turn even the saddest Realtor frown up-side down—sales volume.
According to data fetched from Hawaii Information Systems (the local Multiple Listing Service), the volume of home sales in two key East Hawai‘i markets has increased dramatically since 2014.
Hilo’s core housing market saw the number of homes sold in the first and second quarter of the year increase from 81 sales in 2014 to 130 sales in 2016 (a 60% increase).
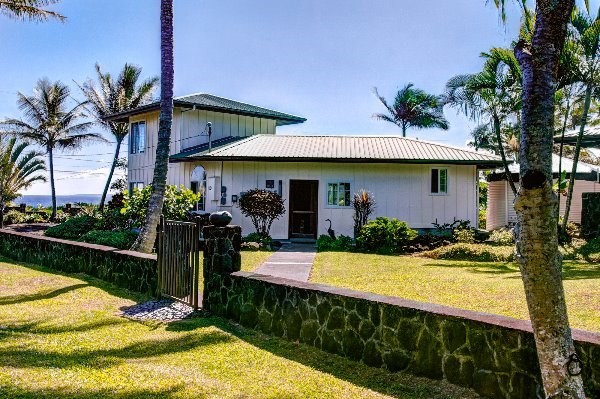
Some of the most dramatic growth in the real estate market in 2016 has happened in Hawaiian Paradise Park (HPP). Image courtesy Donna Duryea, Elite Pacific Properties.
An even more dramatic increase in activity could be found in Hawaiian Paradise Park, where the number of closed sales rose from 118 in the first two quarters of 2014 to 202 in the first two quarters of 2016 (a surge of over 71%).
The South Kohala District also saw a bump in volume during that same time period, with 133 homes sold from January through June of 2016, compared to 101 homes sold in that period two years prior, a 32% increase.
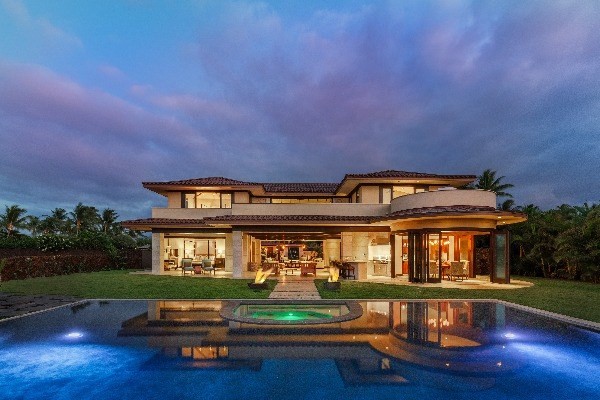
South Kohala saw a nice bump in sales volume between 2014 and 2016, while Kailua-Kona remained stable. Image courtesy Carrie Nicholson, Hawaii Life Real Estate Brokers.
Kailua-Kona’s pace of sales remained relatively stable by contrast, decreasing from 230 to 215 homes sold between 2014 and 2016’s first two quarters (a negligible percentage change).
Anecdotally, many brokers have been describing an increasingly intense market over the last few months, with buyers beginning to compete more vigorously in an effort to secure desirable properties.
We’ll fact check those claims in a few weeks when data from the third quarter of 2016 is released, to see if sellers and their agents will continue their “happy dance” into the fall season.
Editor’s Note
To measure these statistics, data was sampled from select portions of Hilo, Kona and other markets described below:
Hilo was measured using County of Hawai‘i tax map keys 3-2-1 to 3-2-5 (Downtown Hilo, Keaukaha, Waiakea, Kaumana). Properties north of Wailuku River are much more variable in size and quality, making tax map keys 3-2-6 to 3-2-9 (Pu‘ueo, Papaikou, Pepe‘ekeo, Hakalau) more difficult to compare year-over-year with typical residential properties in Hilo’s core.
Hawaiian Paradise Park was defined as County of Hawai‘i tax map key 3-1-5, composed primarily of homes sold on one acre parcels. HPP as it is known provides a nice measure of housing performance in the Puna area, as it is primarily made up of one acre parcels with similar amenities (overhead electricity for instance).
Parcels in other areas of Puna can vary tremendously in size, quality and value.
The same could be said of measuring property in Kona, defined here as County of Hawai‘i tax map keys 3-7-3 to 3-8-2 (Kealakehe, Kailua-Kona, Keahou, portions of Captain Cook). Properties north and south of those areas can vary tremendously in size and value (homes in Kukio, for instance, can sell in the $10 million-plus range, while property north of Konawaena High School often includes large coffee farms).
Kohala was defined as County of Hawai‘i tax map key 3-6 in entirety (Waimea, Waikoloa and Mauna Lani, for instance). These areas have enough residential home sales with relatively similar parcel sizes to form a reasonably reliable year-over-year measure of housing sales volume.
The above areas also represent relatively large sample sizes. Smaller housing markets, such as Volcano Village, for instance, (tax map key 3-1-9) often do not have enough housing sales each year to form a noticeable trend pattern.
Sponsored Content


