During Kīlauea Volcano’s recent Lower East Rift Zone (LERZ) eruption, lava flow maps were a staple of the public outreach effort by the USGS Hawaiian Volcano Observatory (HVO). This was not the first time such maps have been in the public eye, as regular maps of Puʻu ʻŌʻō lava flows have been posted to HVO’s website for many years. Still, this summer’s dynamic situation in lower Puna presented its own unique set of cartographic (map-making) challenges, which kept HVO and other U.S. Geological Survey staff on their toes for over three months.
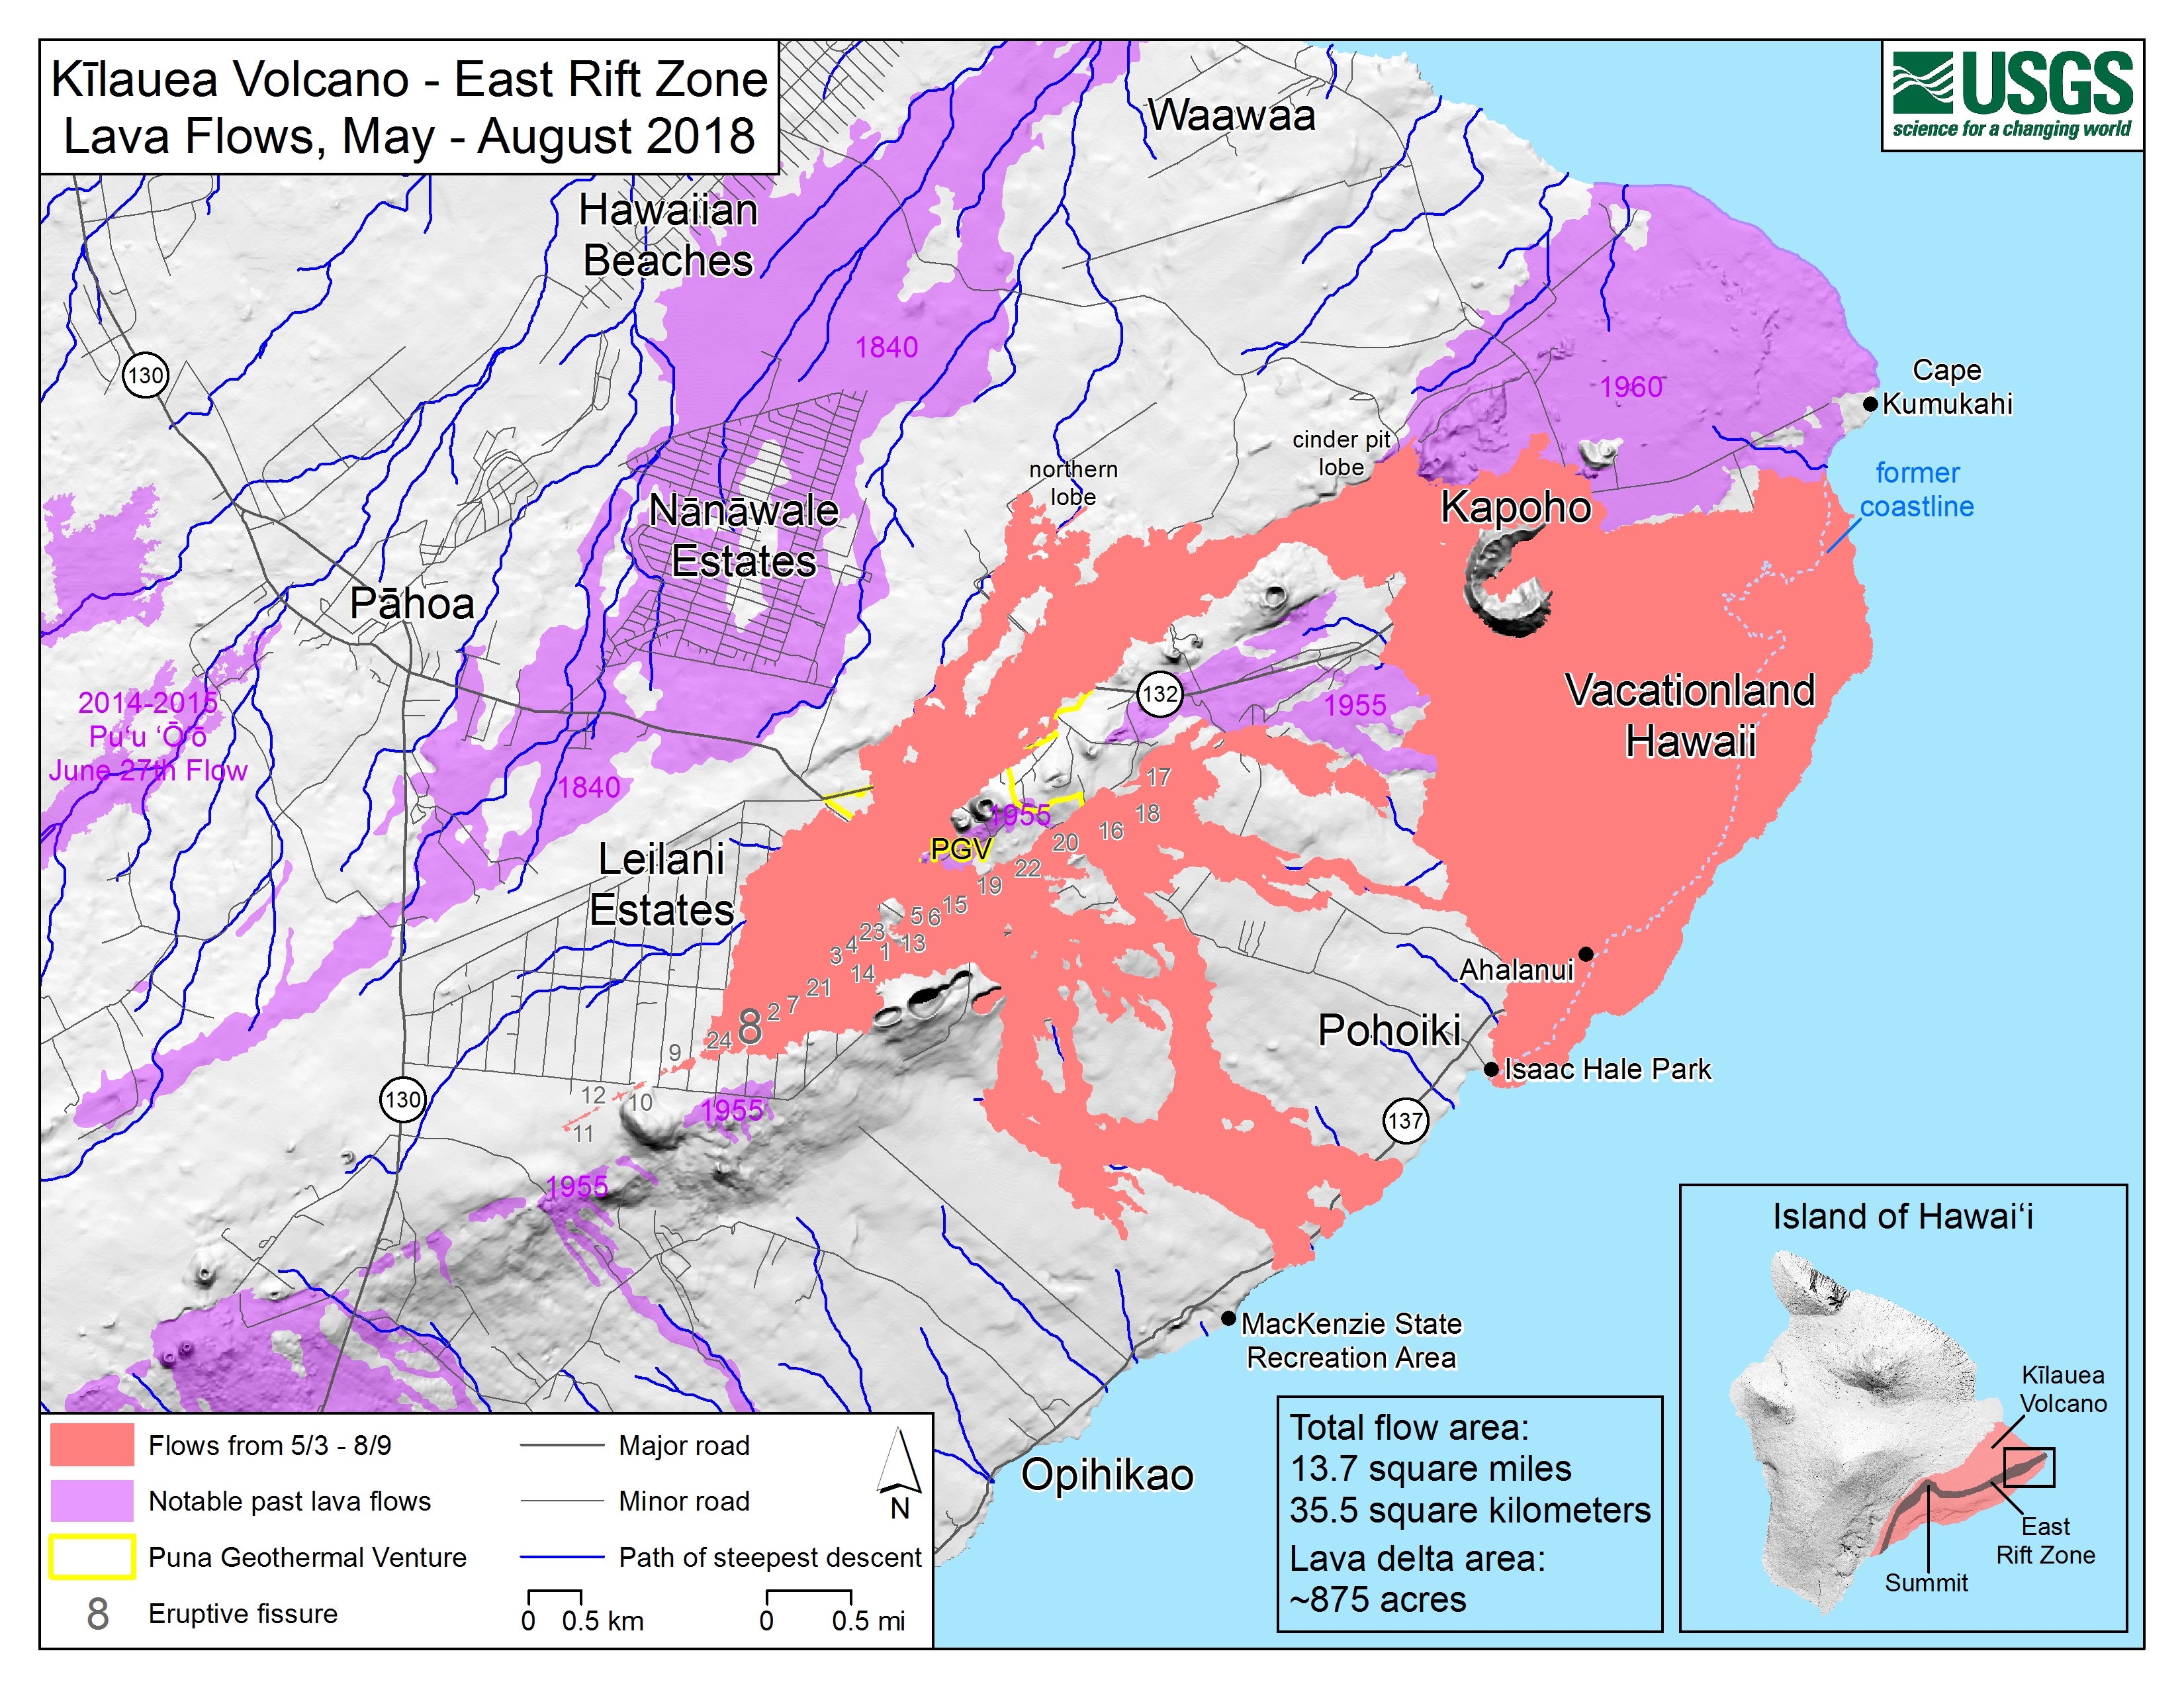
This map of Kīlauea Volcano’s lower East Rift Zone, created by USGS Geographic Information Systems (GIS) analysts, shows the extent of the 2018 lava flows (pink), which covered an area of about 35.5 sq km (13.7 sq mi) and added about 875 acres of new land to East Hawaiʻi. There has been no lava flow expansion since August 9, 2018. Minor activity within the fissure 8 cone continued into early September 2018 but did not expand the flow margins. Shaded purple areas depict lava flows erupted in 1840, 1955, 1960, and 2014-2015. USGS map.
Computer programs known as Geographic Information Systems (GIS) have been the preferred tool of USGS cartographers for many years. Using commercial GIS software, the user creates a stack of “layers,” such as labels, roads, and political boundaries that together form a map.
When magma intruded into the LERZ in early May 2018, HVO prepared a template map of the region that could be ready for rapid distribution if/when lava erupted to the surface. The first eruptive fissure opened in the Leilani Estates subdivision in the late afternoon of May 3, and HVO released its first eruption map the next morning.
In designing this map, GIS analysts considered various logical rules for symbolizing and stacking the layers. For example, roads are shown in shades of gray because other colors could cause confusion, with blue often used for streams or paths of steepest descent, and red reserved for lava flows.
In the stacking order, a lava flow is always on top, because it effectively destroys everything that was once in its place. A road shown on top of a lava flow would suggest that it survived or was recently rebuilt.
ARTICLE CONTINUES BELOW AD
ARTICLE CONTINUES BELOW AD
The LERZ map was also heavily influenced by earlier Puʻu ʻŌʻō maps. Using a similar cartographic style helped ensure that the LERZ eruption maps were familiar to people accustomed to viewing maps on HVO’s website.
For the first week of the 2018 LERZ eruption, lava flows proved difficult to map, as they stayed close to the fissures in Leilani Estates, where vegetation obscured aerial views of their margins. Mapping the lava on foot, which had been common for Puʻu ʻŌʻō flows, was too dangerous because the dense understory also blocked exit routes.
As a result, HVO initially used simple dots to depict the eruptive fissures on early maps. To any GIS analyst, it is far from ideal to display a two- or three-dimensional feature with a point location, but such compromises can be necessary during a crisis.
Later, as the lava inundation in lower Puna grew more expansive, satellite views became the preferred method of mapping the flow field.
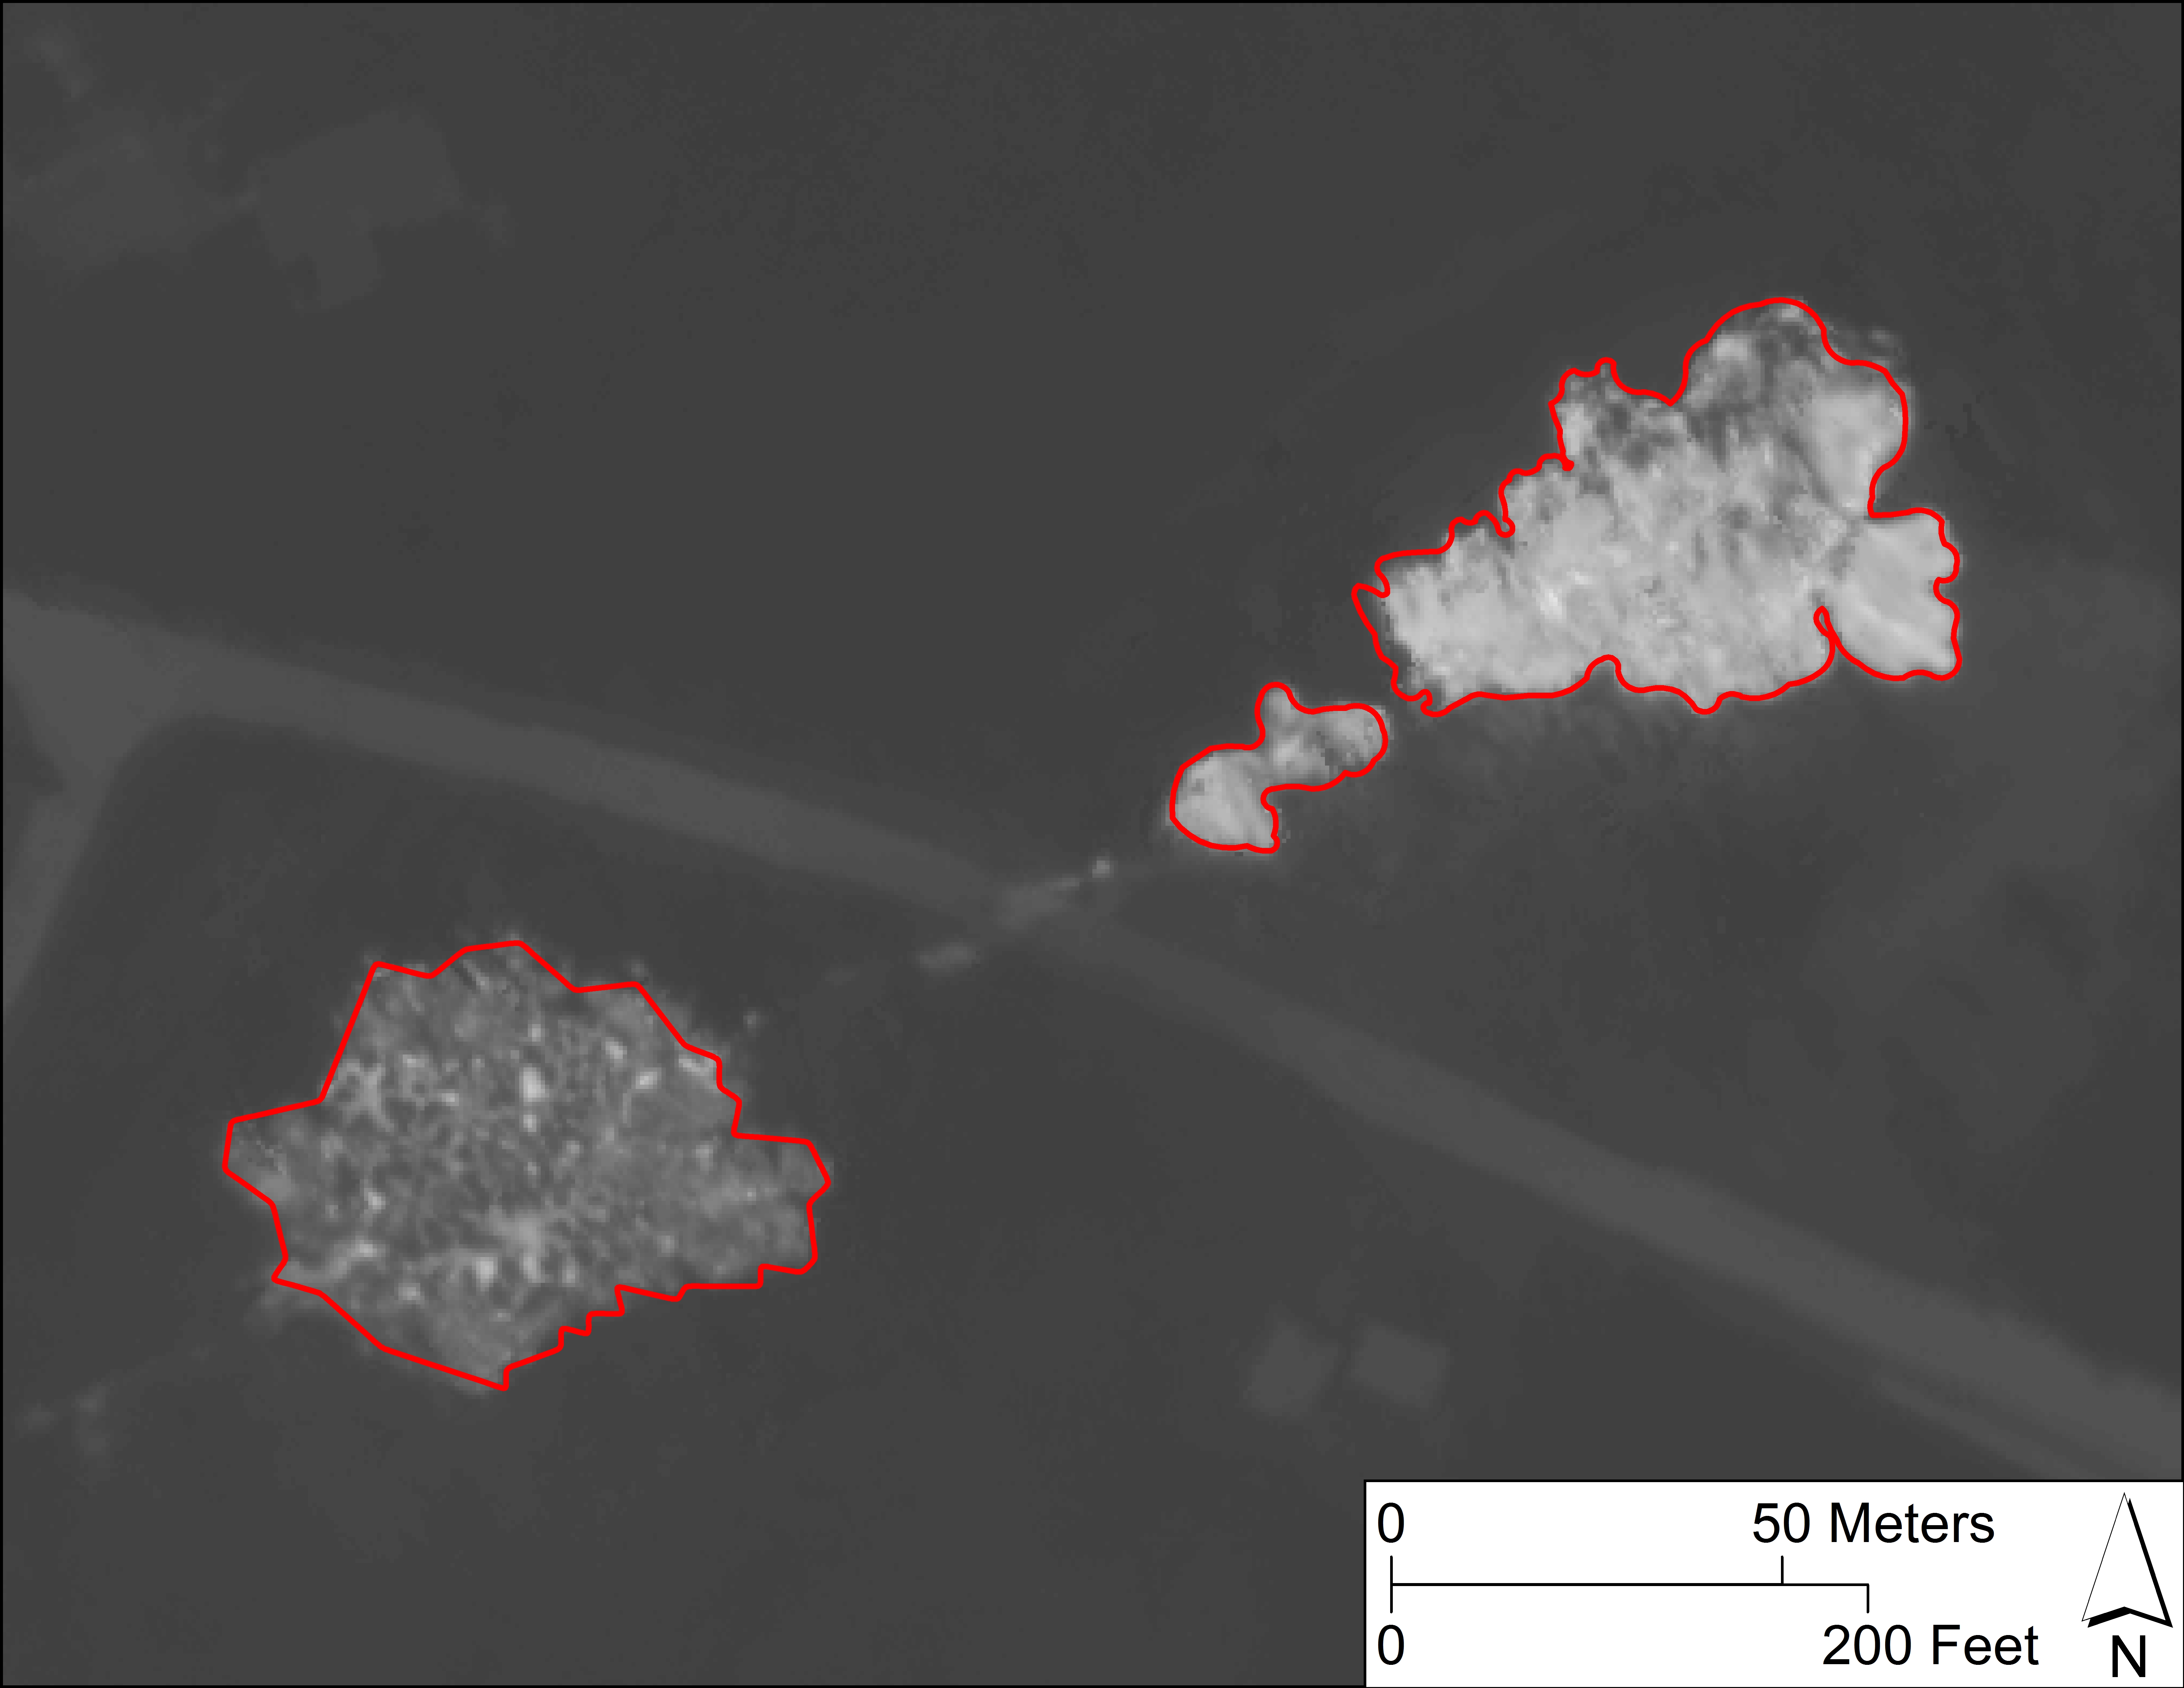
Bright red polygon features were drawn by USGS Geographic Information Systems (GIS) analysts around new or active lower East Rift Zone lava flows, which appear lighter in color due to their high temperature on this thermal map. Collected during a helicopter overflight on May 9, 2018, this map shows fissures 6 (left) and 15 (right) with Pohoiki Road passing between the two vents. USGS map.
USGS colleagues with the National Civilian Applications Center reviewed various satellite imagery sources, including those of the Department of Defense, and drew two-dimensional polygons around lava flows that had been emplaced since the previous update. After “ground truthing” these new data with field checks by USGS crews, the polygons were added to the eruption map in bright red. When satellite views were unavailable, polygons were derived using a similar process from helicopter-collected thermal maps.
ARTICLE CONTINUES BELOW AD
The process of drawing polygons from satellite or thermal imagery could take a few hours. Unfortunately, the speed at which some LERZ lava flows advanced could render those maps obsolete almost immediately.
This led GIS analysts to employ more “aggressive” methods of mapping. For example, some maps posted in late May and early June 2018 showed a simple arrow and point for the flow front, which had been pinpointed only minutes before during a helicopter overflight. If aerial photographs included landmarks, it was possible for GIS analysts to sketch the flow fronts onto pre-eruption satellite images. These methods accelerated the map-making process when the need for information became most critical.
Every volcanic eruption is different, and certainly the next major Hawaiian eruption will require new, and even more innovative, methods of lava-flow mapping. The recent LERZ eruption was a learning experience for everyone involved, especially for staff making HVO’s eruption maps. By expanding the various data collection methods available to GIS analysts, HVO and the USGS will be even better prepared when responding to future volcanic activity.
Volcano Activity Updates
Kīlauea is not erupting. Low rates of seismicity, deformation, and gas release have not changed significantly over the past week.
ARTICLE CONTINUES BELOW AD
Small earthquakes at Kīlauea’s summit continue, as do aftershocks of the May 4, 2018, magnitude-6.9 earthquake on the volcano’s south flank.
A slight inflationary trend near and east of Puʻu ʻŌʻō suggests that magma may be refilling the middle East Rift Zone. Low seismicity and reduced gas emissions do not indicate that the magma is shallow, but HVO continues to closely monitor this area and will report any significant changes.
Sulfur dioxide (SO2) emissions across Kīlauea remain drastically reduced, with a combined rate of less than 300 tonnes/day. Small amounts of hydrogen sulfide gas (H2S) are being released in cooler, wetter volcanic environments, and from decaying vegetation and other organic matter. The human nose is extremely sensitive to the “rotten egg” smell of H2S; some people can detect this gas at less than 0.001 parts per million. Residents have reported smelling H2S downwind of Kīlauea, but these concentrations are well below hazardous levels. More information online.
The USGS Volcano Alert level for Mauna Loa remains at NORMAL.
No Hawai‘i earthquakes received three or more felt reports (minimum to be recounted here) this past week.
Visit HVO’s website for past Volcano Watch articles, Kīlauea and Mauna Loa updates, volcano photos, maps, recent earthquake info, and more. Call 808-967-8862 for weekly Kīlauea updates. Email questions to [email protected].
Volcano Watchis a weekly article and activity update written by U.S. Geological Survey Hawaiian Volcano Observatory scientists and affiliates.
This comments section is a public community forum for the purpose of free expression. Although Big Island Now encourages respectful communication only, some content may be considered offensive. Please view at your own discretion. View Comments