Image courtesy of DBEDT, Research and Economic Analysis Division.
The State Department of Business, Economic Development and Tourism (DBEDT) has released comprehensive census data highlighting age, gender and race population characteristics based on the state and county data from the 2016 U.S. Census Bureau. The data accounts for single years of age for residents, civilians and the military population from 2010 to 2016.
Age Characteristics
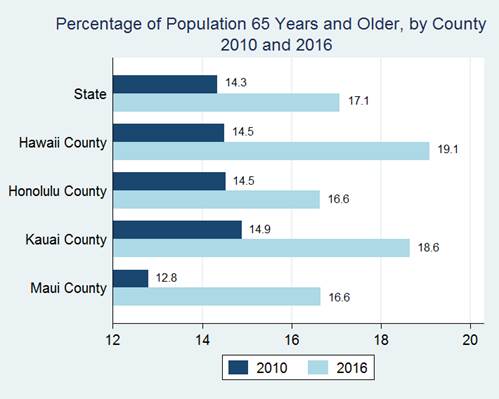
According to the data, Hawai’iʻs total population grew by 5 percent between April 1, 2010, and July 1, 2016, with an average annual growth rate of 0.8 percent. For the elderly population–those 65 years and older–there was a 25 percent increase between the same time period, averaging at 3.6 percent in annual growth. In 2016, the elderly accounted for 17.1 percent of the statewide population.
In Hawai‘i County, the average annual growth rate for people 65 and older between April 1, 2010, and July 1, 2016, was 5.7 percent–the highest throughout the state.
ARTICLE CONTINUES BELOW AD
ARTICLE CONTINUES BELOW AD
The data revealed that the voting age population, or those 18 years and older, made up 78.4 percent of the population in Hawai‘i as measured on July 1, 2016. Statewide, there were similar numbers for this specific population ranging from 77.7 percent to 78.6 percent across all counties.
The median age for Hawai‘i residents remains the same as it was on April 1, 2010: 38.6 years old. Hawai‘i County had the highest median age at 42.2 years old, followed by Kauai County at 41.6 years, and Maui County at 40.8 years. Honolulu County had the lowest median age at 37.4 years.
Between April 1, 2010, and July 1, 2016, Hawai‘i’s ratio of dependent-age population–those under 18 years of age or those 65 and older–to the working-age population–people between the ages of 18 and 64–increased. In 2010, there were 58 dependent-age people for every 100 working-age people. In 2016, there were 63 dependent-age people for every 100 working-age people.
Image courtesy of DBEDT, Research and Economic Analysis Division.
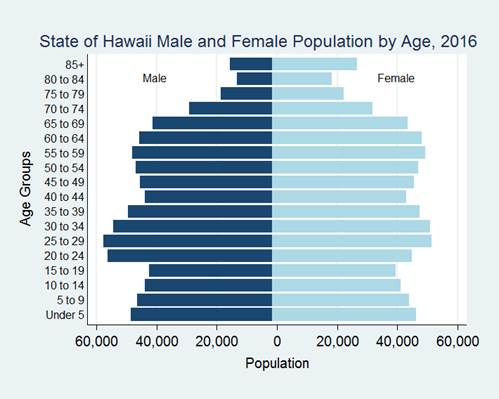
Gender Breakdown
ARTICLE CONTINUES BELOW AD
Hawai‘i’s gender distribution nearly breaks even according to census data, consisting of 50.2 percent males and 49.8 percent females. Honolulu County has the highest percentage of males at 50.4 percent, followed by Maui County at 49.9 percent, and Hawai‘i County and Kauai County both at 49.8 percent.
Racial Composition
Asians accounted for 57 percent of the total state population in the recent data. Honolulu County had the largest percentage of Asian population at 61.3 percent, followed by Kauai County at 51.3 percent, Maui County at 47.8 percent and Hawai‘i County at 45.1 percent.
Native Hawaiians and Other Pacific Islanders accounted for 26.7 percent of Hawai‘i’s total population. Hawai‘i County had the largest share of Native Hawaiians and Other Pacific Islanders at 35.1 percent, followed by Maui County at 28.4 percent, Kauai County at 26 percent and Honolulu County at 24.7 percent.
ARTICLE CONTINUES BELOW AD
Whites accounted for 43.3 percent of the total state population. Hawai‘i County had the largest percentage of Whites at 56.5 percent. Maui County and Kauai County had the next largest percentage at 51.7 percent, followed by Honolulu County at 38.7 percent.
Black or African American accounted for 3.6 percent of the population in the State of Hawai‘i. The largest share of the population resides in Honolulu County, measuring at 4.2 percent of the countyʻs total population.
American Indians and Alaska Natives made up 2.7 percent of the total state population. The largest share of the population appeared in Hawai‘i County, making up 4.9 percent of the countyʻs total population.
Mixed race population was 23.7 percent of the total state population.
Minority population–defined by the U.S. Census Bureau as those identifying their race as other than non-Hispanic, White race alone–comprised 77.9 percent of Hawai‘iʻs total population. By county, Honolulu County was the highest with a 81.4 percent minority population. Next was Kauai County at 70.4 percent, followed by Hawai‘i County at 69.8 percent and Maui County at 69.5 percent.
This comments section is a public community forum for the purpose of free expression. Although Big Island Now encourages respectful communication only, some content may be considered offensive. Please view at your own discretion. View Comments