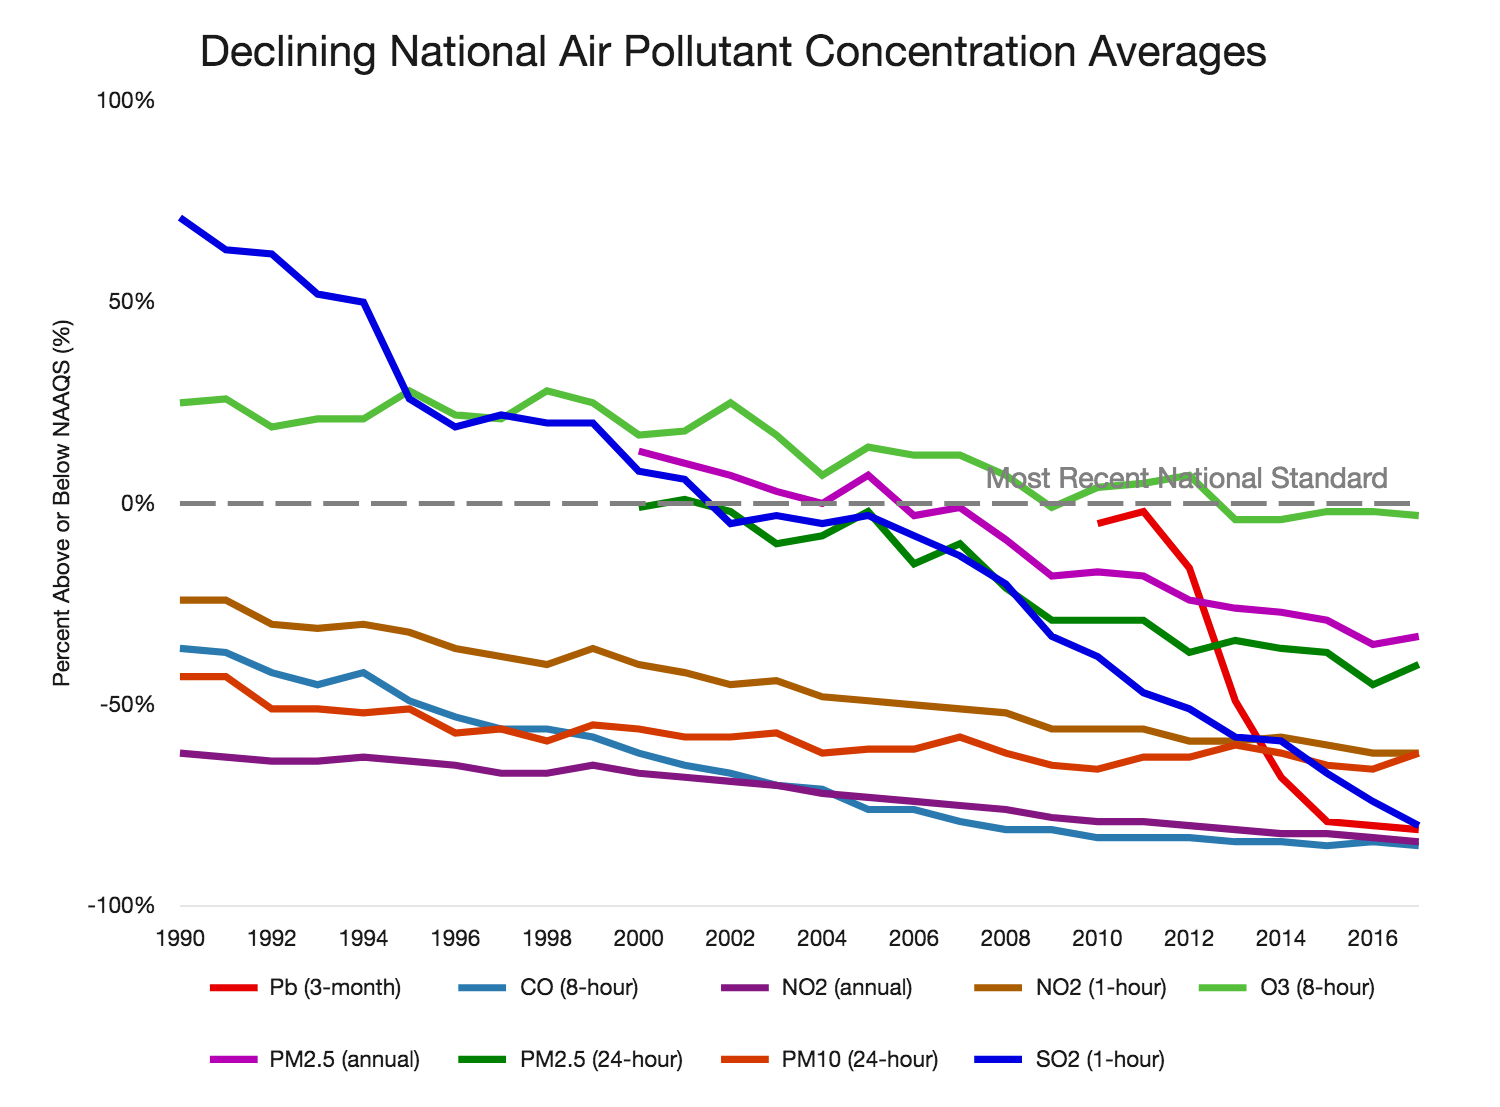
Graphic credit: The EPA’s “Our Nation’s Air: Status and Trends Through 2017” report.
The U.S. Environmental Protection Agency released its annual report on air quality on July 31, 2018, tracking the nation’s progress in improving air quality since the passage of the Clean Air Act.
“Our Nation’s Air: Status and Trends Through 2017” documents the considerable improvements in air quality across America over more than 45 years.
“Through federal and state implementation of the Clean Air Act and technological advances in the private sector, America has achieved one of the great public-private successes of our time—dramatically improving air quality and public health while simultaneously growing the nation’s population and economy,” said EPA Acting Administrator Andrew Wheeler. “This report details a remarkable achievement that should be recognized, celebrated and replicated around the world. A 73% reduction in any other social ill, such as crime, disease, or drug addiction, would lead the evening news.”
ARTICLE CONTINUES BELOW AD
ARTICLE CONTINUES BELOW AD
EPA’s most recent report highlights that between 1970 and 2017, the combined emissions of six key pollutants dropped by 73%, while the U.S. economy grew more than three times. A closer look at more recent progress shows that between 1990 and 2017, average concentrations of harmful air pollutants decreased significantly across our nation:
Even with this success, some Americans still live in areas that do not fully meet national standards and EPA continues to work with states, local governments, tribes and citizens—to further improve air quality across the entire country.
ARTICLE CONTINUES BELOW AD
The report includes interactive graphics that enable citizens, policymakers and stakeholders to view and download detailed information by pollutant, geographic location and year.
Explore the report and download graphics and data here.
This comments section is a public community forum for the purpose of free expression. Although Big Island Now encourages respectful communication only, some content may be considered offensive. Please view at your own discretion. View Comments