The U.S. Geological Survey released this map and pictures on Sunday, June 3, 2018.
Map as of 11 a.m., June 3, 2018.
Click to enlarge
Given the dynamic nature of Kīlauea’s lower East Rift Zone eruption, with changing vent locations, fissures starting and stopping, and varying rates of lava effusion, map details shown here are accurate as of the date/time noted. Shaded purple areas indicate lava flows erupted in 1840, 1955, 1960 and 2014-2015.
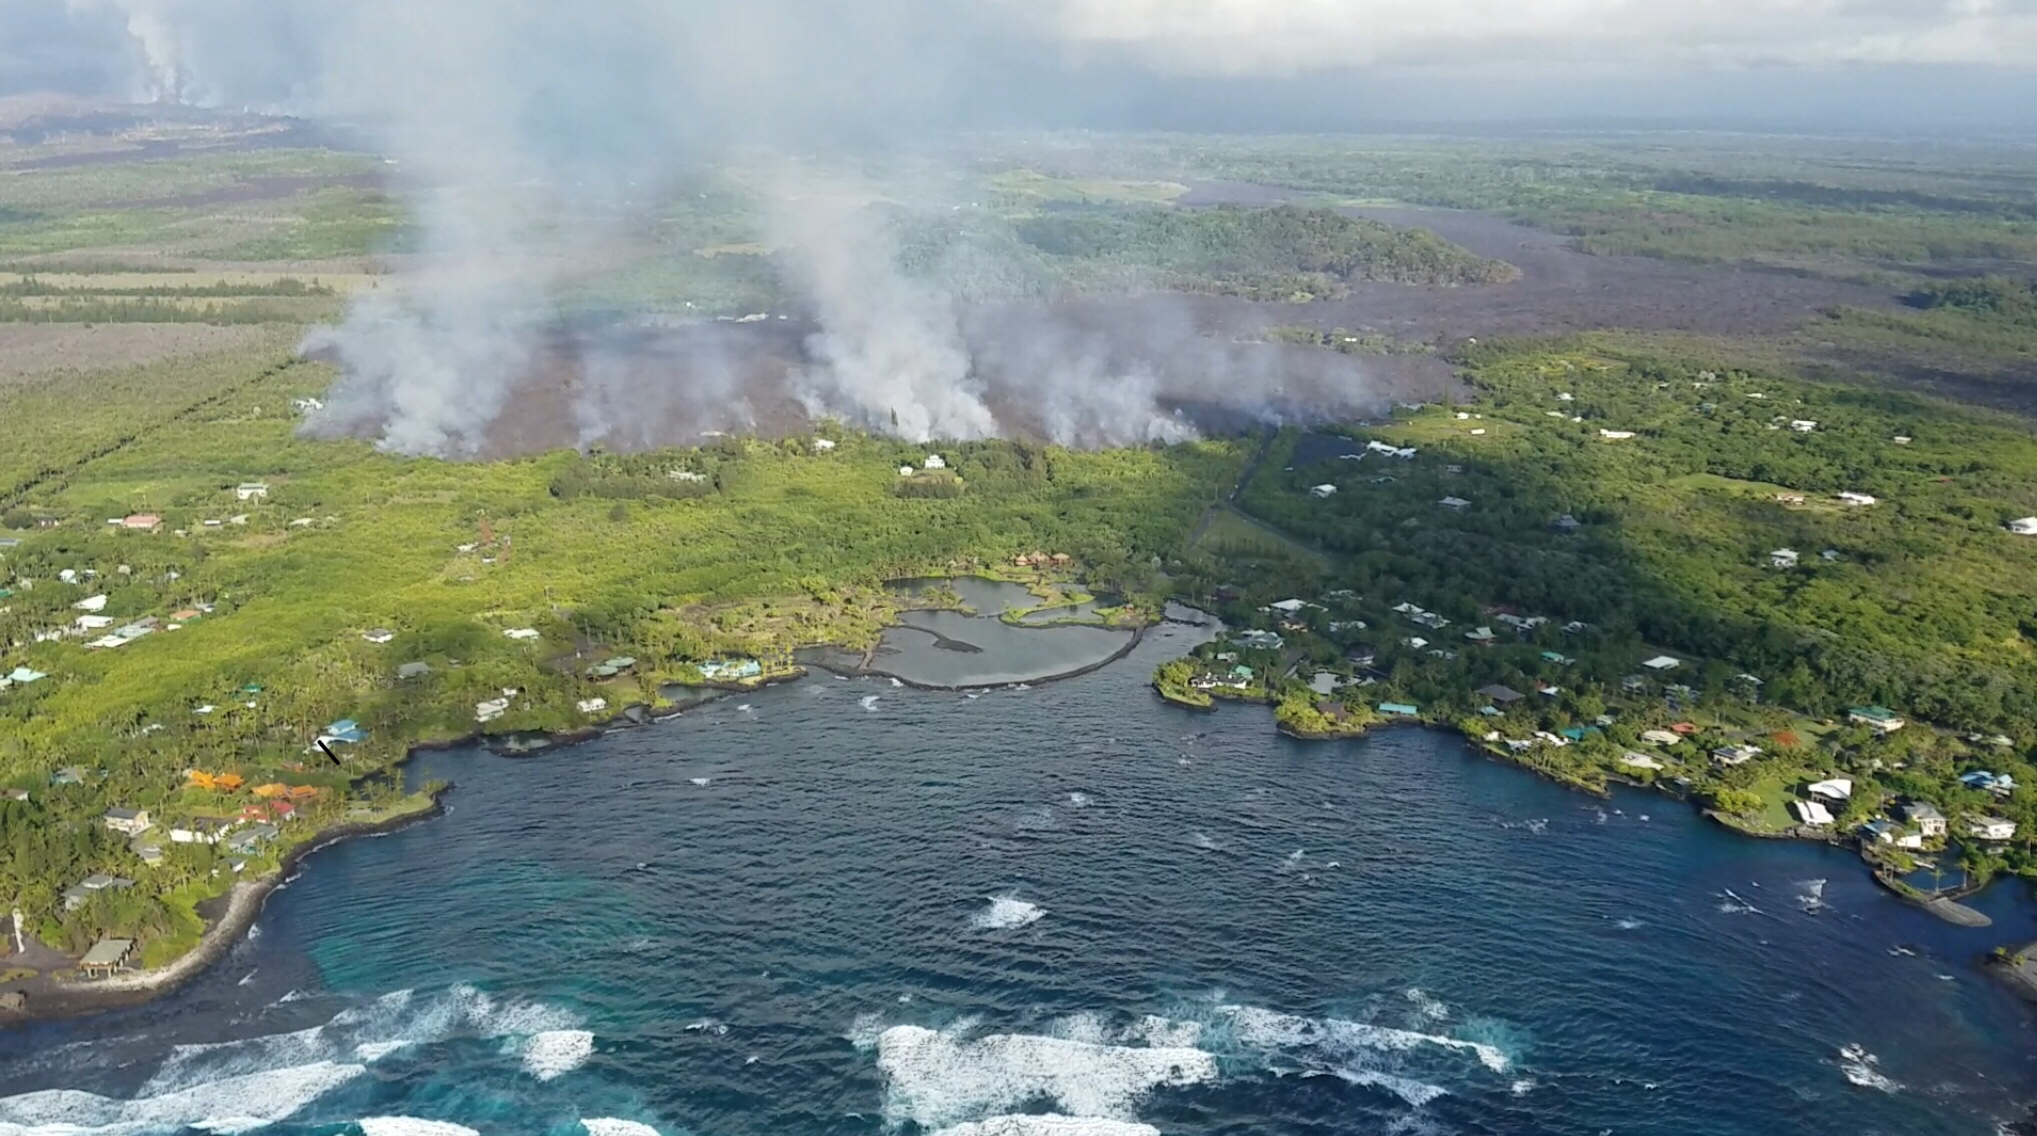
Photos from 7 a.m. helicopter overflight on Sunday, June 3, 2018.
Click to enlarge
ARTICLE CONTINUES BELOW AD
ARTICLE CONTINUES BELOW AD
Hovering offshore and looking up the flowfront. Nearly all of the front was active and advancing; advance rates were estimated at an average of 250 feet/hour and as of 7 a.m. the flow was 500 yards from the ocean.
Overflight photo at 7 a.m. from offshore looking up the flowfront.
Click to enlarge
Nearly all of the front was active and advancing/spreading.
ARTICLE CONTINUES BELOW AD
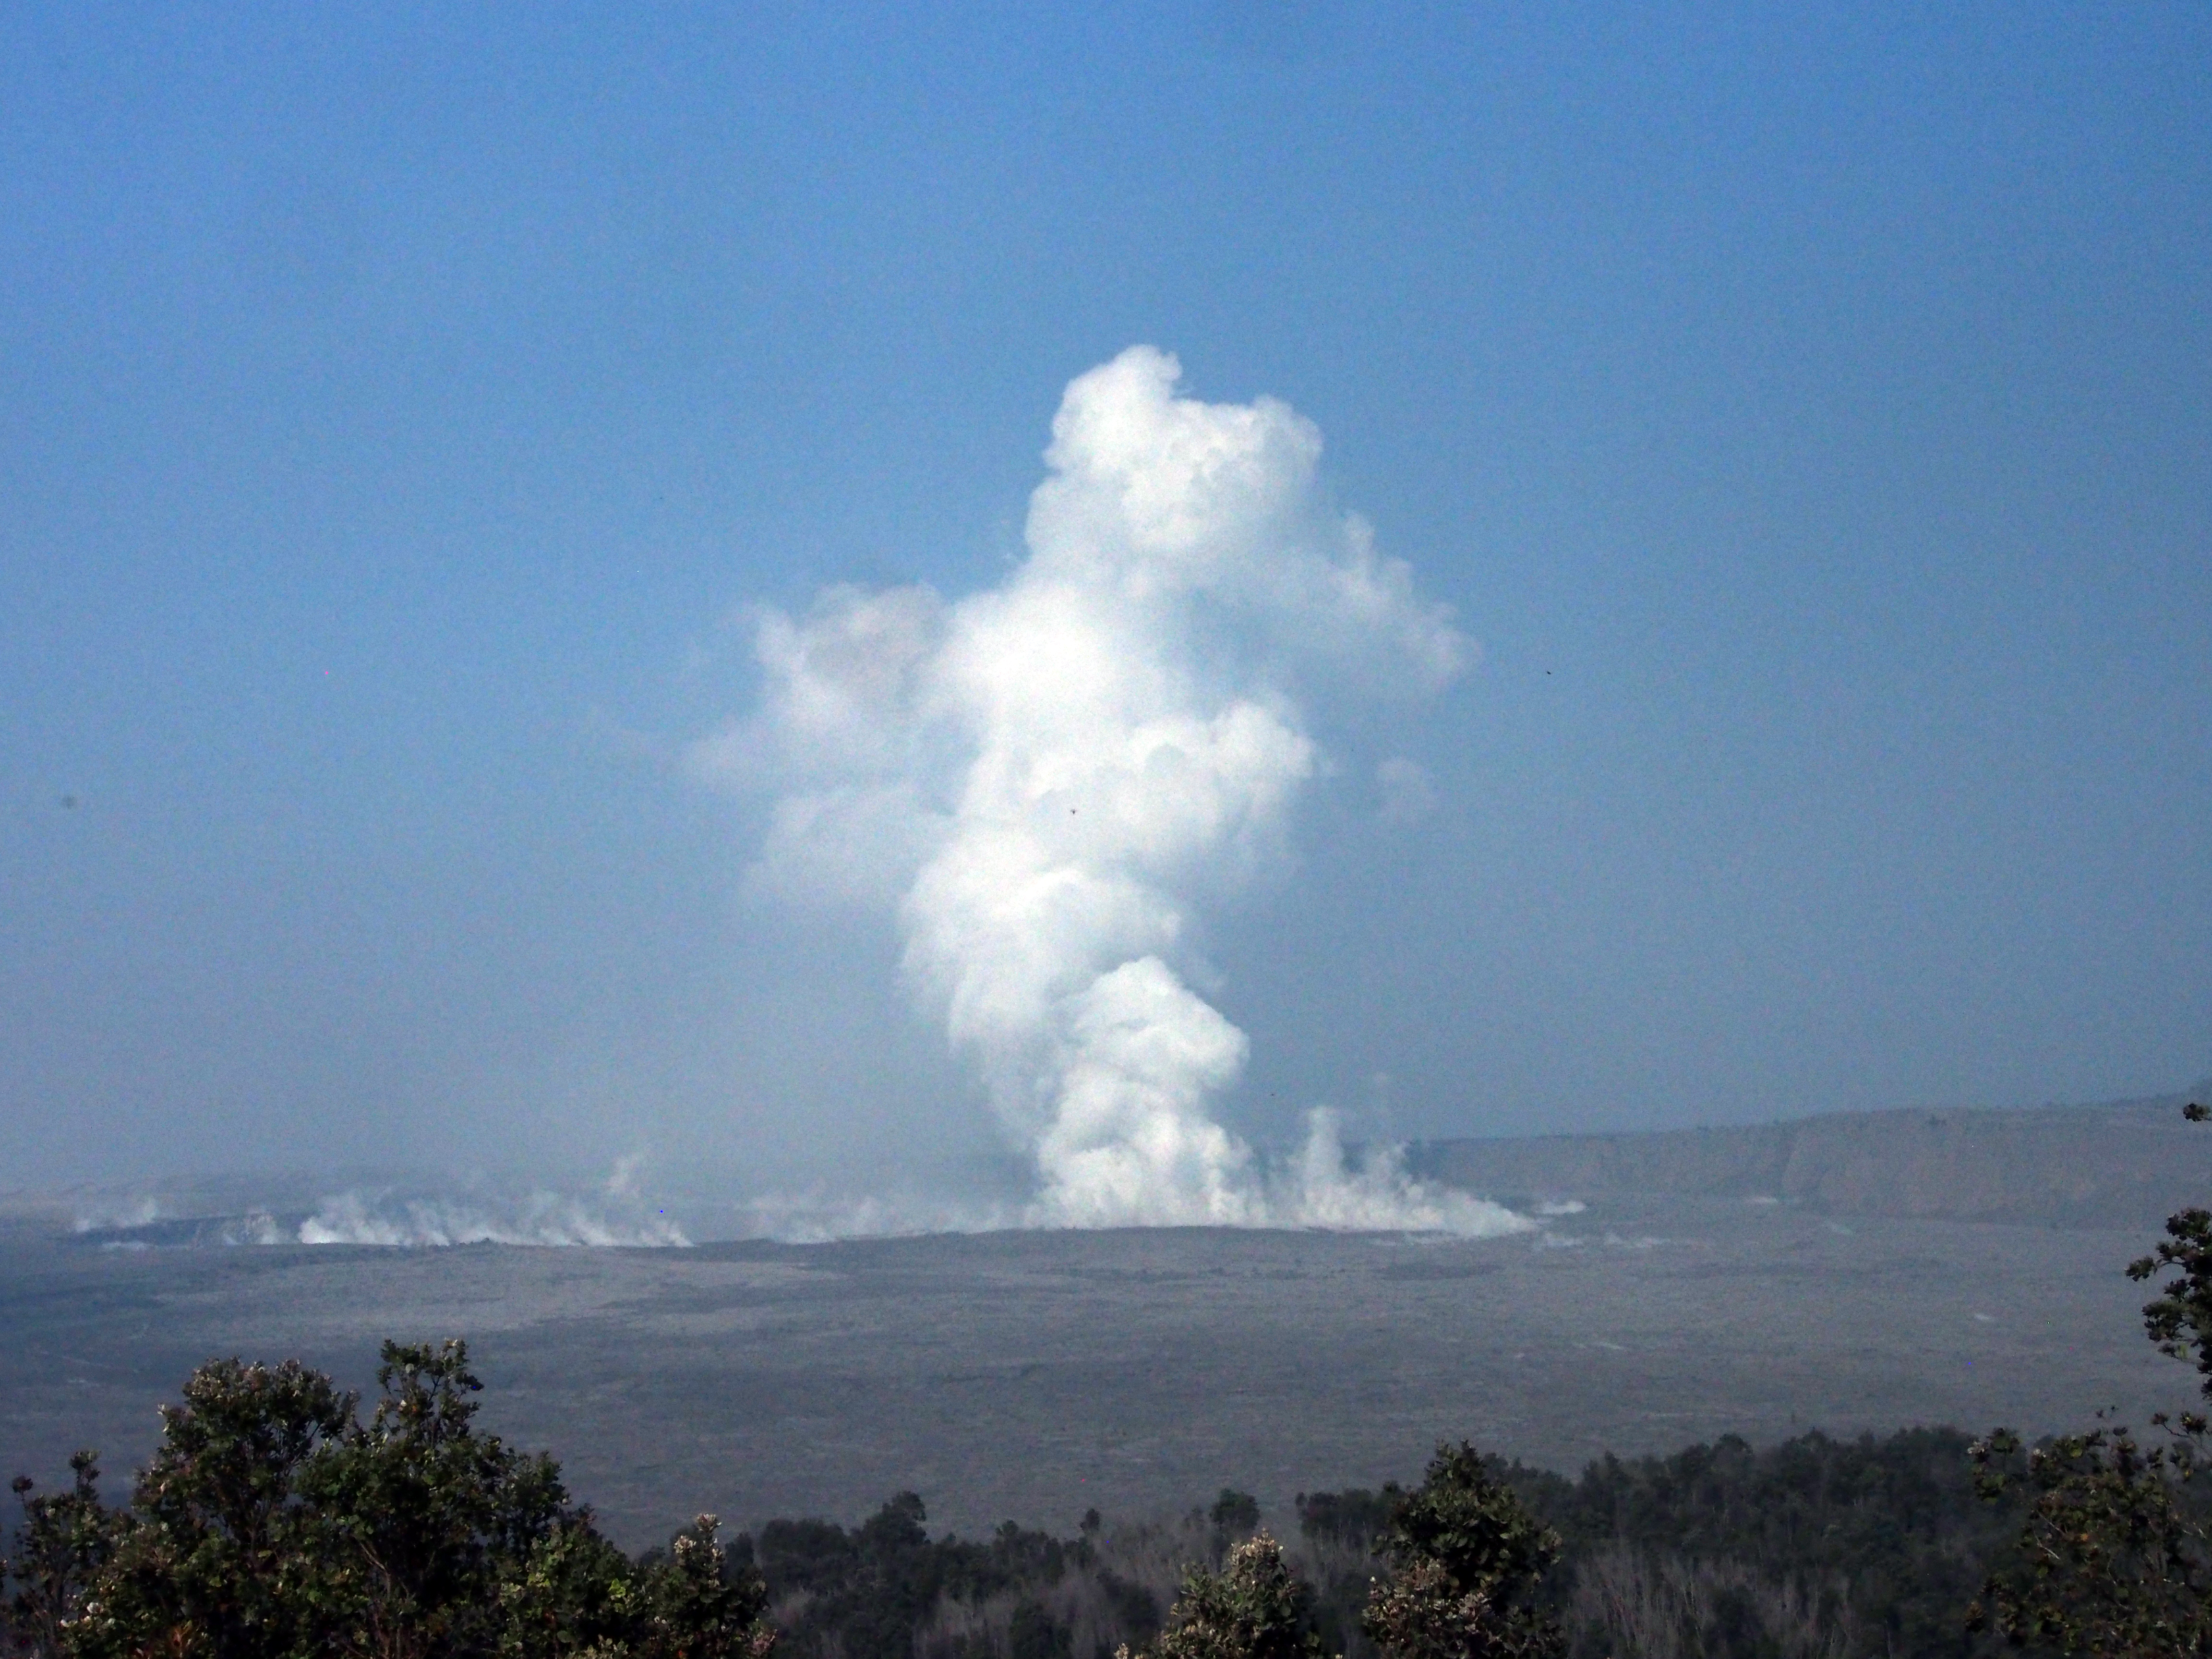
Summit plume at 8:40 a.m on June 3.
Click to enlarge
A slight mist in the air softens the look of the plume, which is predominantly white steam with very minor amounts of ash.
This comments section is a public community forum for the purpose of free expression. Although Big Island Now encourages respectful communication only, some content may be considered offensive. Please view at your own discretion. View Comments