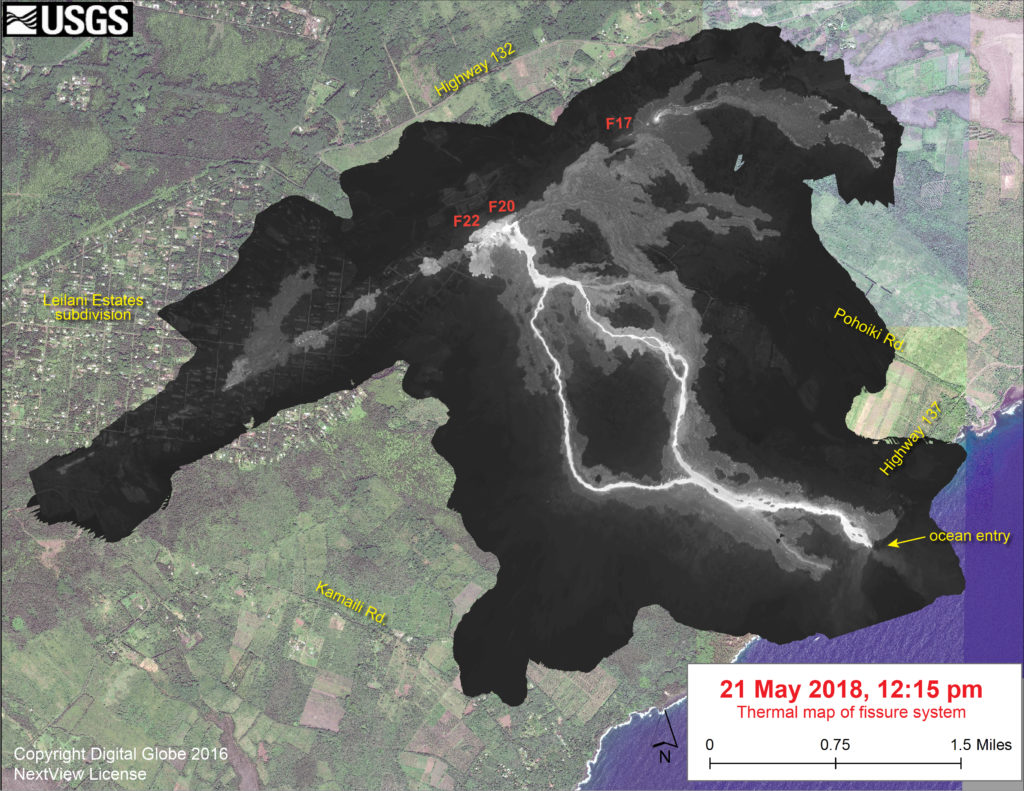
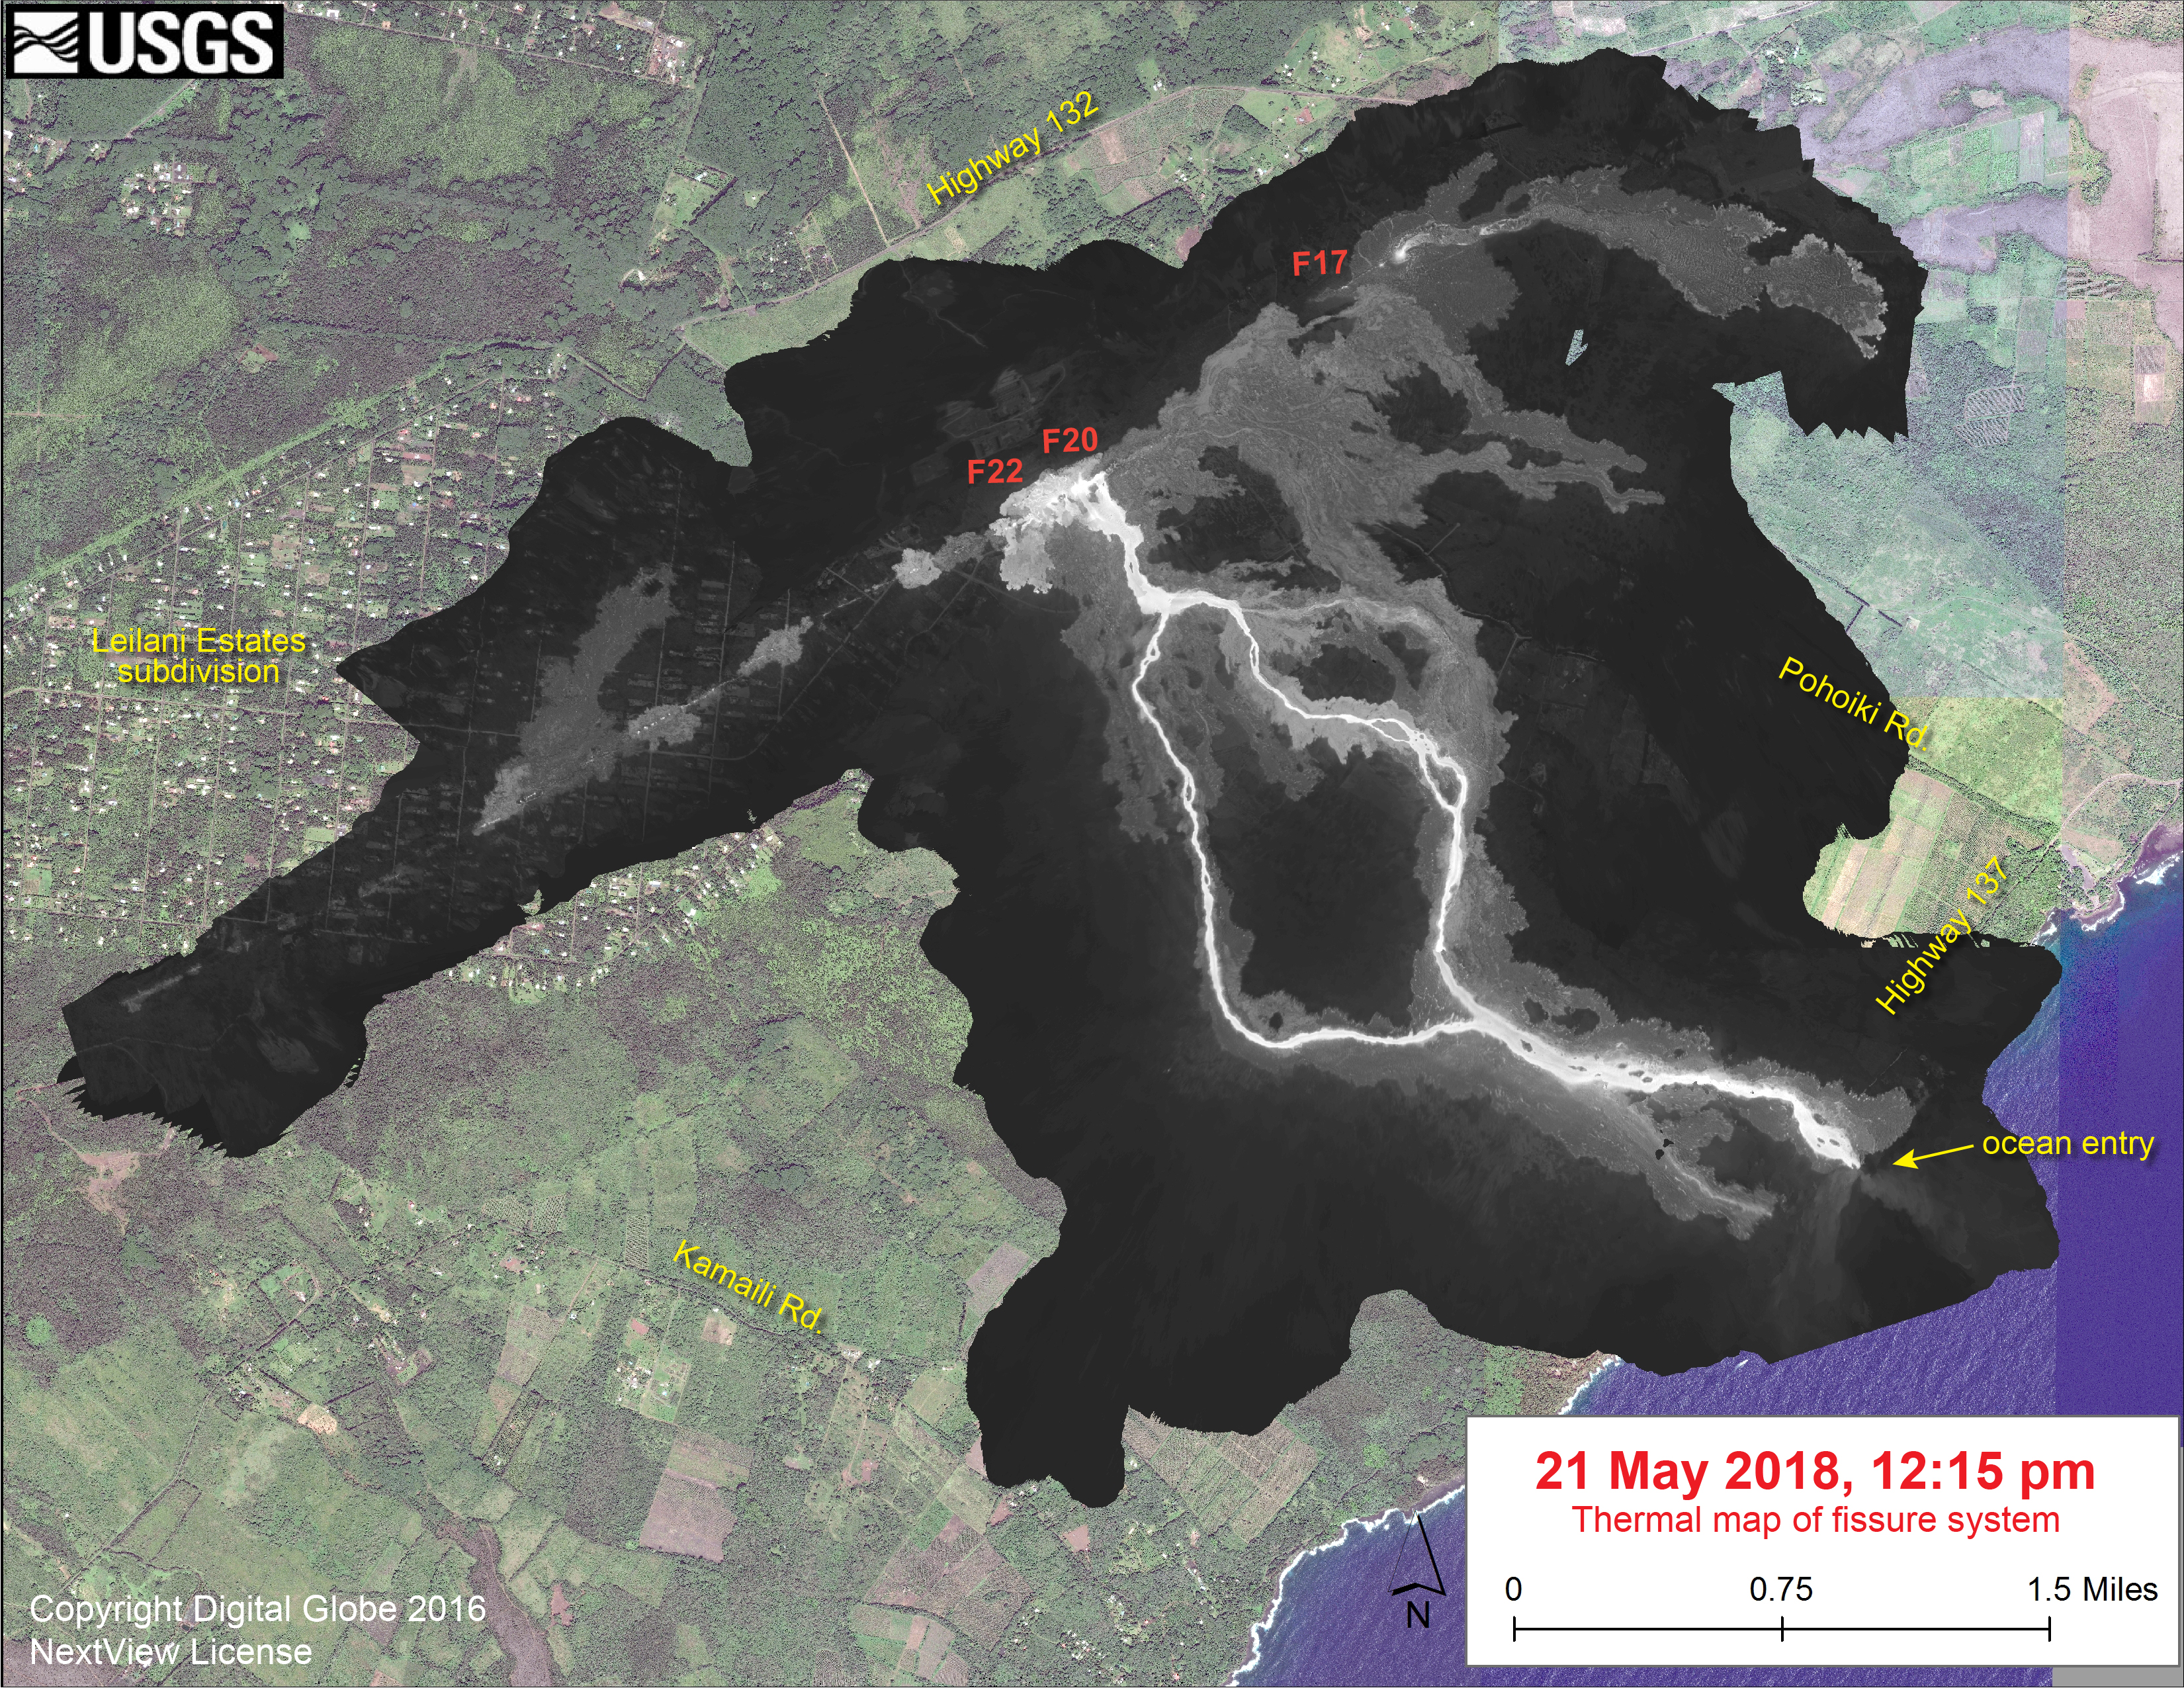
The U.S. Geological Survey released this thermal map that shows the fissure system and lava flows as of 12:15 p.m. on Monday, May 21, 2018.
Click to enlarge
The primary lava flows originate from the Fissure 20-22 area. The dominant ocean entry is marked. The black and white area is the extent of the thermal map. Temperature in the thermal image is displayed as gray-scale values, with the brightest pixels indicating the hottest areas. The thermal map was constructed by stitching many overlapping oblique thermal images collected by a handheld thermal camera during a helicopter overflight of the flow field. The base is a copyrighted color satellite image (used with permission) provided by Digital Globe.
This comments section is a public community forum for the purpose of free expression. Although Big Island Now encourages respectful communication only, some content may be considered offensive. Please view at your own discretion. View Comments