The U.S. Geological Survey released this map of the East Rift Zone as of 2:30 p.m. The map on Monday, May 14, shows the location of fissure 17, which opened Sunday, May 13, at approximately 4:30 a.m., and the area covered by an ‘a‘ā flow since then. The flow front as of 2:30 p.m. is shown by the small red circle with label. The flow is following well a path of steepest descent (blue line), immediately south of the 1955 ‘a‘ā flow boundary.
Shaded purple areas indicate lava flows erupted in 1840, 1955, 1960, and 2014-2015.Map courtesy of USGS. Click to enlarge
ORIGINAL POST:
The U.S. Geological Survey has released maps of the East Rift Zone. As of 9 a.m., May 13, 2018, the new map shows the location of fissure 17, which opened on the morning of May 13 at approximately 4:30 a.m.
Shaded purple areas indicate lava flows erupted in 1840, 1955, 1960 and 2014-15. Click to enlarge.
ARTICLE CONTINUES BELOW AD
ARTICLE CONTINUES BELOW AD
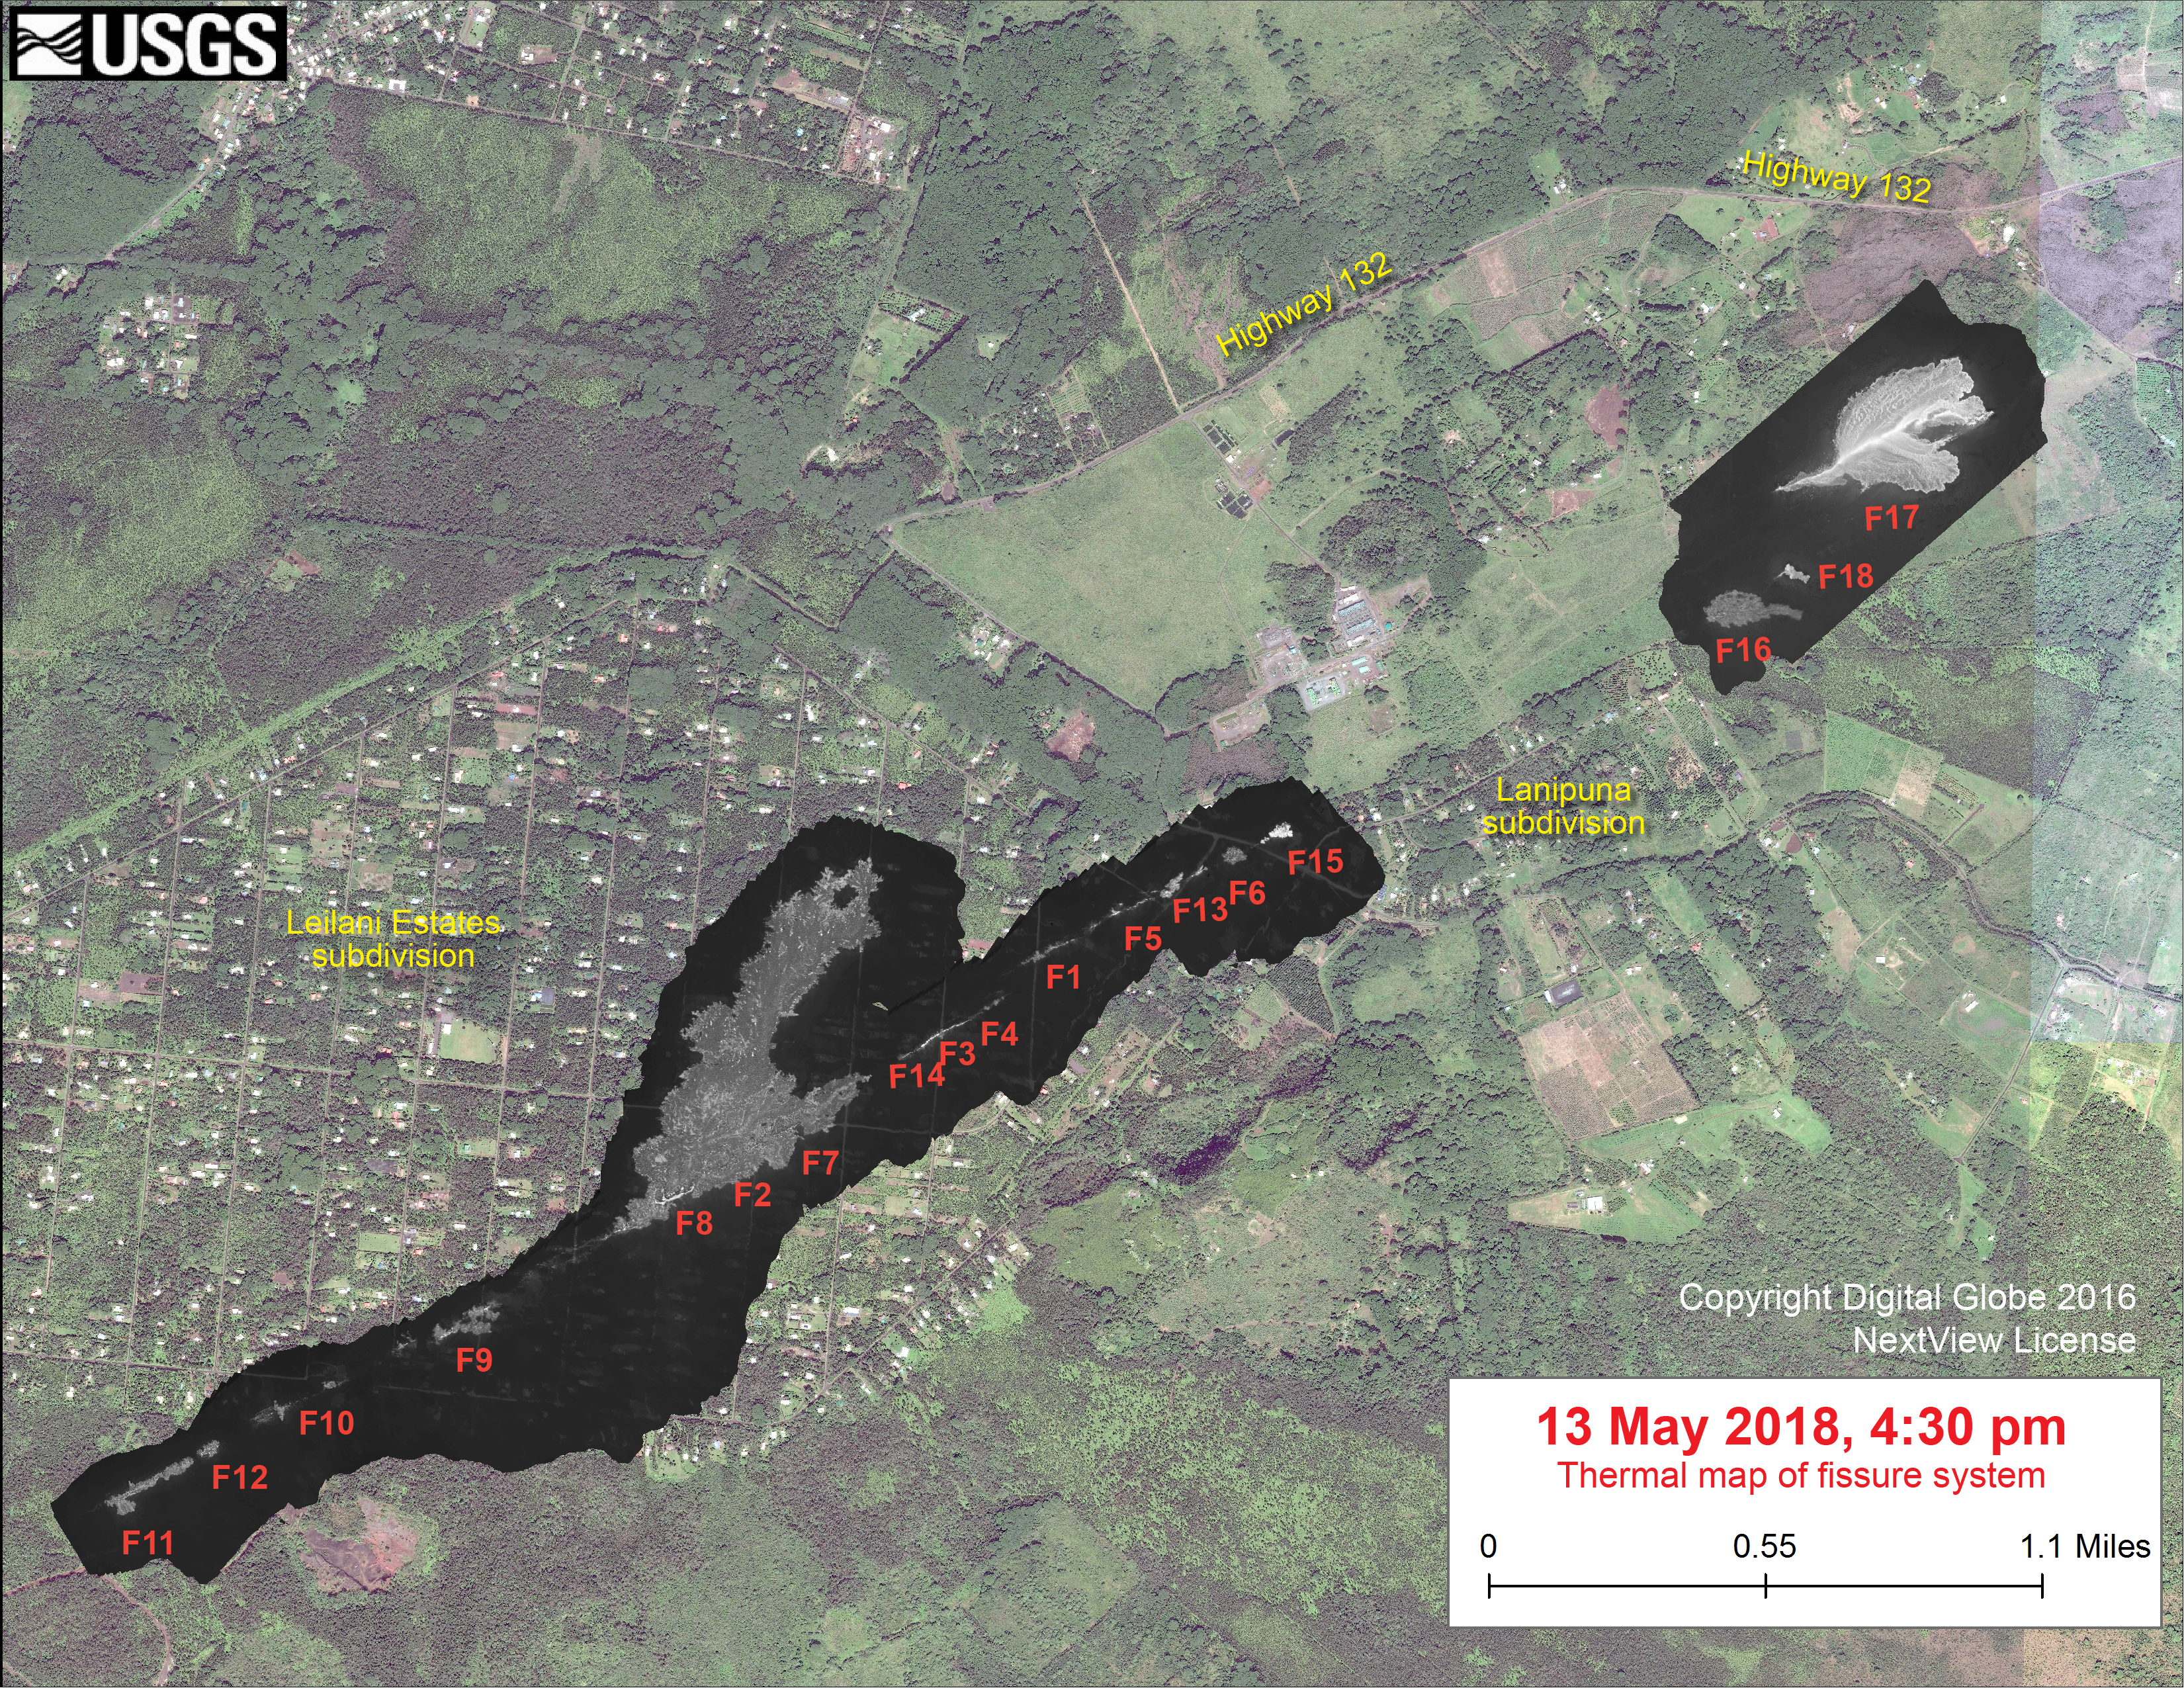
This new fissure was initially referred to as fissure 18 in early reports, but that is incorrect (what was called fissure 17 yesterday did not erupt lava, so this morning’s erupting fissure is actually 17). In addition to fissure 17, the map shows earlier fissures, lava flows and steaming areas. The inset map (lower right) shows fissures in Leilani Estates in the order they occurred since May 3.
This map overlays a georegistered mosaic of thermal images collected during a helicopter overflight of Kīlauea’S lower East Rift Zone fissures on the Island of Hawai‘i on May 13, 2018, at 4:30 p.m. HST.
The base is a copyrighted satellite image (used with permission) provided by Digital Globe. Temperature in the thermal image is displayed as gray-scale values, with the brightest pixels indicating the hottest areas (white shows active breakouts). The thermal map was constructed by stitching many overlapping oblique thermal images collected by a handheld thermal camera during a helicopter overflight of the flow field. Click to enlarge
As of Monday morning, May 14, lava from fissure 17 had traveled just under a mile, roughly east-southeast parallel to the rift zone, and was turning slightly south; at 8:30 a.m., the flow was about 0.5 mile south of Highway 132. Fissure 18, which became active late yesterday, was weakly active. Fissure 19, which is not shown on the map, but is located just northeast of Pohoiki Road and north of Hinalo Street at the east end of Lanipuna Gardens, was weakly active.
ARTICLE CONTINUES BELOW AD
Morning flyover via Mick Kalber and Paradise Helicopters:
This comments section is a public community forum for the purpose of free expression. Although Big Island Now encourages respectful communication only, some content may be considered offensive. Please view at your own discretion. View Comments