The U.S. Geological Survey released these two maps that show where the lava from the fissures could possibly flow if they keep erupting.
This map shows the locations of eruptive fissures in the order that they occurred in the Leilani Estates Subdivision as of 10 a.m. Friday, May 5, 2018.
The blue lines are paths of steepest descent that identify likely paths of a lava flow, if and when lava moves downhill from an erupting vent. Click to enlarge
The paths of steepest-descent were calculated from a 1983 digital elevation model (DEM) of the Island of Hawai‘i, created from digitized contours. Steepest-descent path analysis is based on the assumption that the DEM perfectly represents the earth’s surface. DEMs, however, are not perfect, so the blue lines on this map can be used to infer only approximate lava-flow paths. The base shaded-relief map was made from the 1983 10-m (DEM).
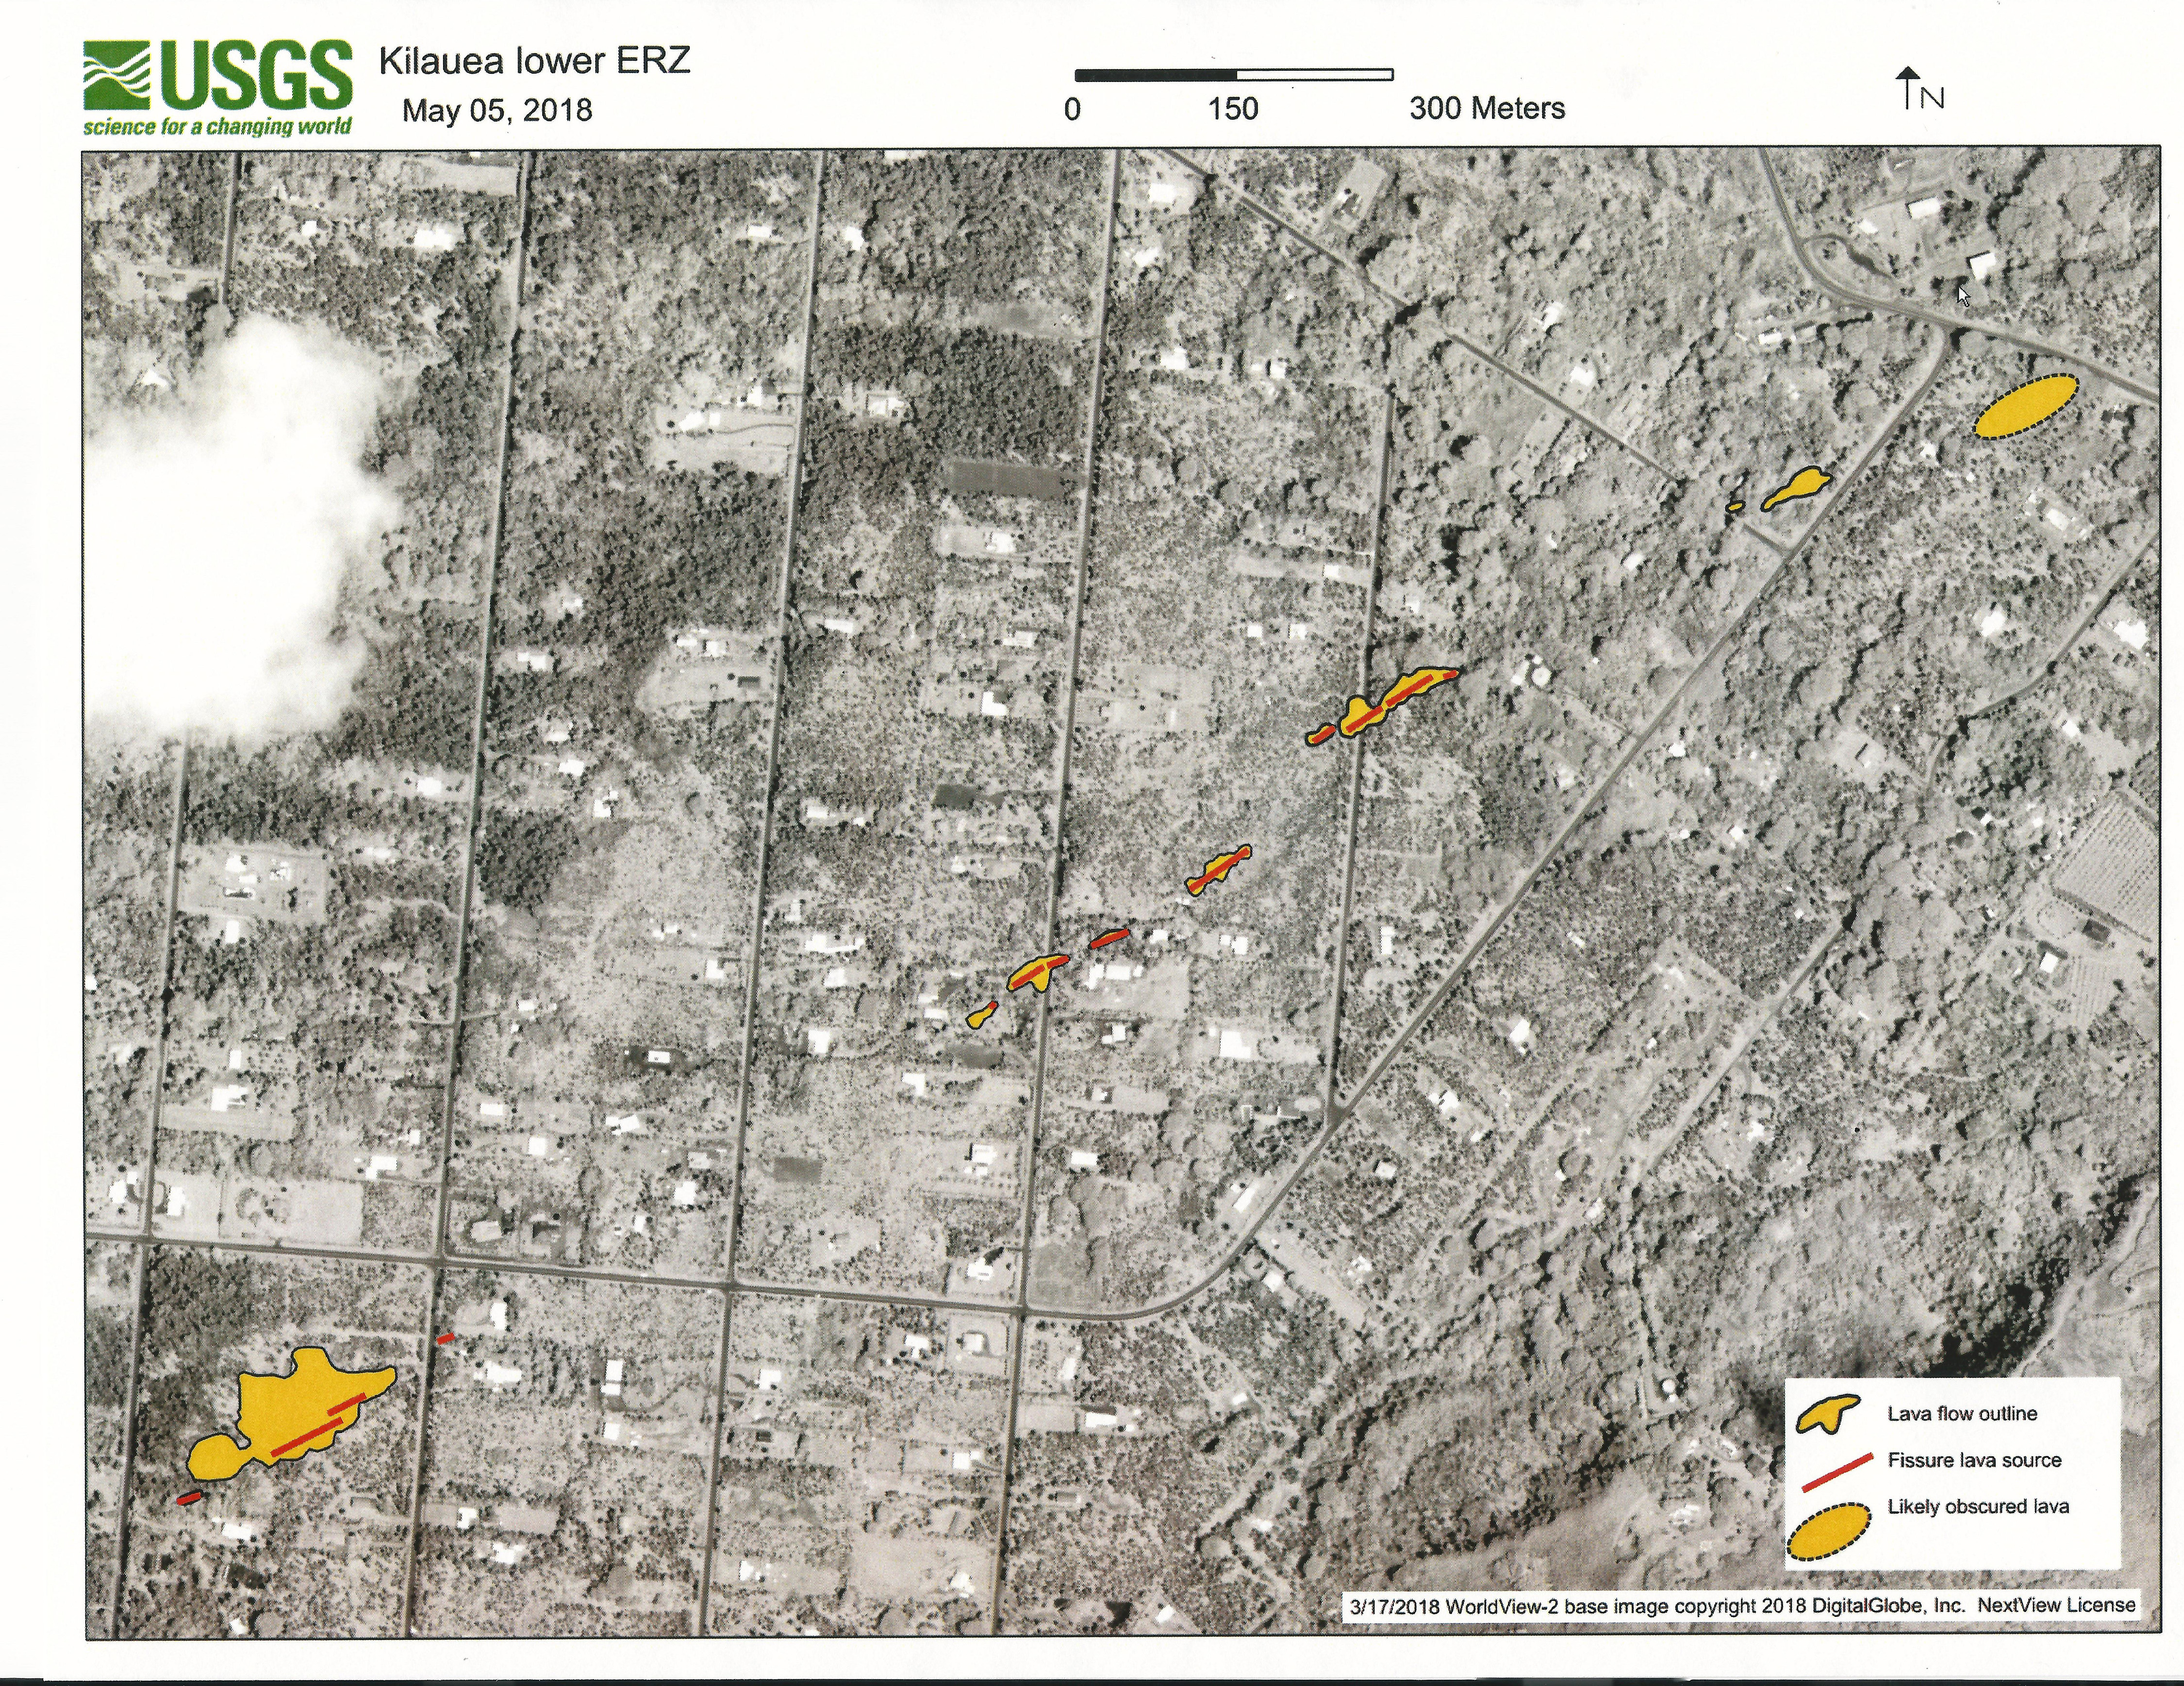
Satellite image of eruptive fissures and area covered with lava, Leilani Estates. Click to enlarge.
This comments section is a public community forum for the purpose of free expression. Although Big Island Now encourages respectful communication only, some content may be considered offensive. Please view at your own discretion. View Comments