The primary goal of the US Geological Survey’s Hawaiian Volcano Observatory is to provide scientific information to reduce risks due to volcanic and seismic activity. To this end, HVO scientists assess volcano hazards and inform the public and civic officials using media outlets, community forums, and other outreach activities.
(2) Close up of Sheet 2 of “Lava inundation zone maps for Mauna Loa, Island of Hawaiʻi,” recently published by the U.S. Geological Survey. Colors depict lava Inundation zones for the Kaumana, Waiākea, and Volcano-Mountain View regions on Mauna Loa. Yellow indicates the volcano’s Northeast Rift Zone, one area along which lava could erupt. The extent of the 1984 eruption and lava flow has been superimposed on the map (shown in red). Had the Mauna Loa inundation maps been available in 1984, they could have been used to determine that the northern portion of Hilo was the most likely area to be impacted by the main lava flow. USGS map.
As an example, HVO has worked to keep Island of Hawaiʻi residents and visitors, as well as people around the world, informed about Kīlauea Volcano’s eruptive activity and hazards for more than three decades.
An eruption on Mauna Loa is not imminent, but it will erupt again someday. When it does, many people, including emergency responders, will need to know which areas are threatened with lava inundation. Researchers at HVO have produced maps that will help Hawaiʻi County Civil Defense and other emergency managers identify people, property, and facilities at risk during future eruptions.
Most of Mauna Loa’s eruptive fissures and vents are located at the summit of the volcano and along two rift zones that extend northeast and southwest from Moku‘āweoweo, the volcano’s summit caldera. A few vents, however, occur along radial fissures that extend primarily north and west from the summit.
The bounding walls of Moku‘āweoweo create topographic barriers that should protect areas southeast and west of the caldera from lava flows erupted from within the caldera. But the barrier on the west side is rendered ineffective by the radial vents on the flanks of the volcano. For example, in 1859, an eruption from radial vents on the northwest flank of Mauna Loa produced lava flows that advanced to the ocean in eight days.
ARTICLE CONTINUES BELOW AD
ARTICLE CONTINUES BELOW AD
Using detailed geologic mapping and modeling of how a fluid (in this case, lava) responds to surface topography, USGS-HVO constructed nine maps depicting 18 inundation zones on Mauna Loa. Each zone identifies a segment of the volcano that could erupt lava and send flows downslope.
Colored regions on these maps show areas on the volcano’s flank that could potentially be covered by flows from future Mauna Loa eruptions. These eruptions could originate from the volcano’s summit, rift zones, or radial vents. It’s likely, however, that only part of a zone would be covered in a single eruption.
The inundation maps provide a good first-order understanding of specific areas that could be affected by Mauna Loa lava flows once a vent is identified. This information is critical for response planning.
When a Mauna Loa eruption starts, the maps can help decision makers quickly identify communities, infrastructure, and roads between possible vent locations and the coast, facilitating more efficient and effective allocation of response resources. The public can also use the maps to consider where lava flows might go once an eruption starts.
ARTICLE CONTINUES BELOW AD
“Lava inundation zone maps for Mauna Loa, Island of Hawaiʻi,” published by the U.S. Geological Survey as Scientific Investigations Map 3387, comprises 10 sheets (maps) and an explanatory pamphlet. Sheet 1 is a map of the entire Island of Hawaiʻi with outlines showing the areas encompassed by the nine other maps. These nine sheets depict the 18 inundation zones for Mauna Loa. Guidelines on how to interpret the maps are provided in the accompanying pamphlet.
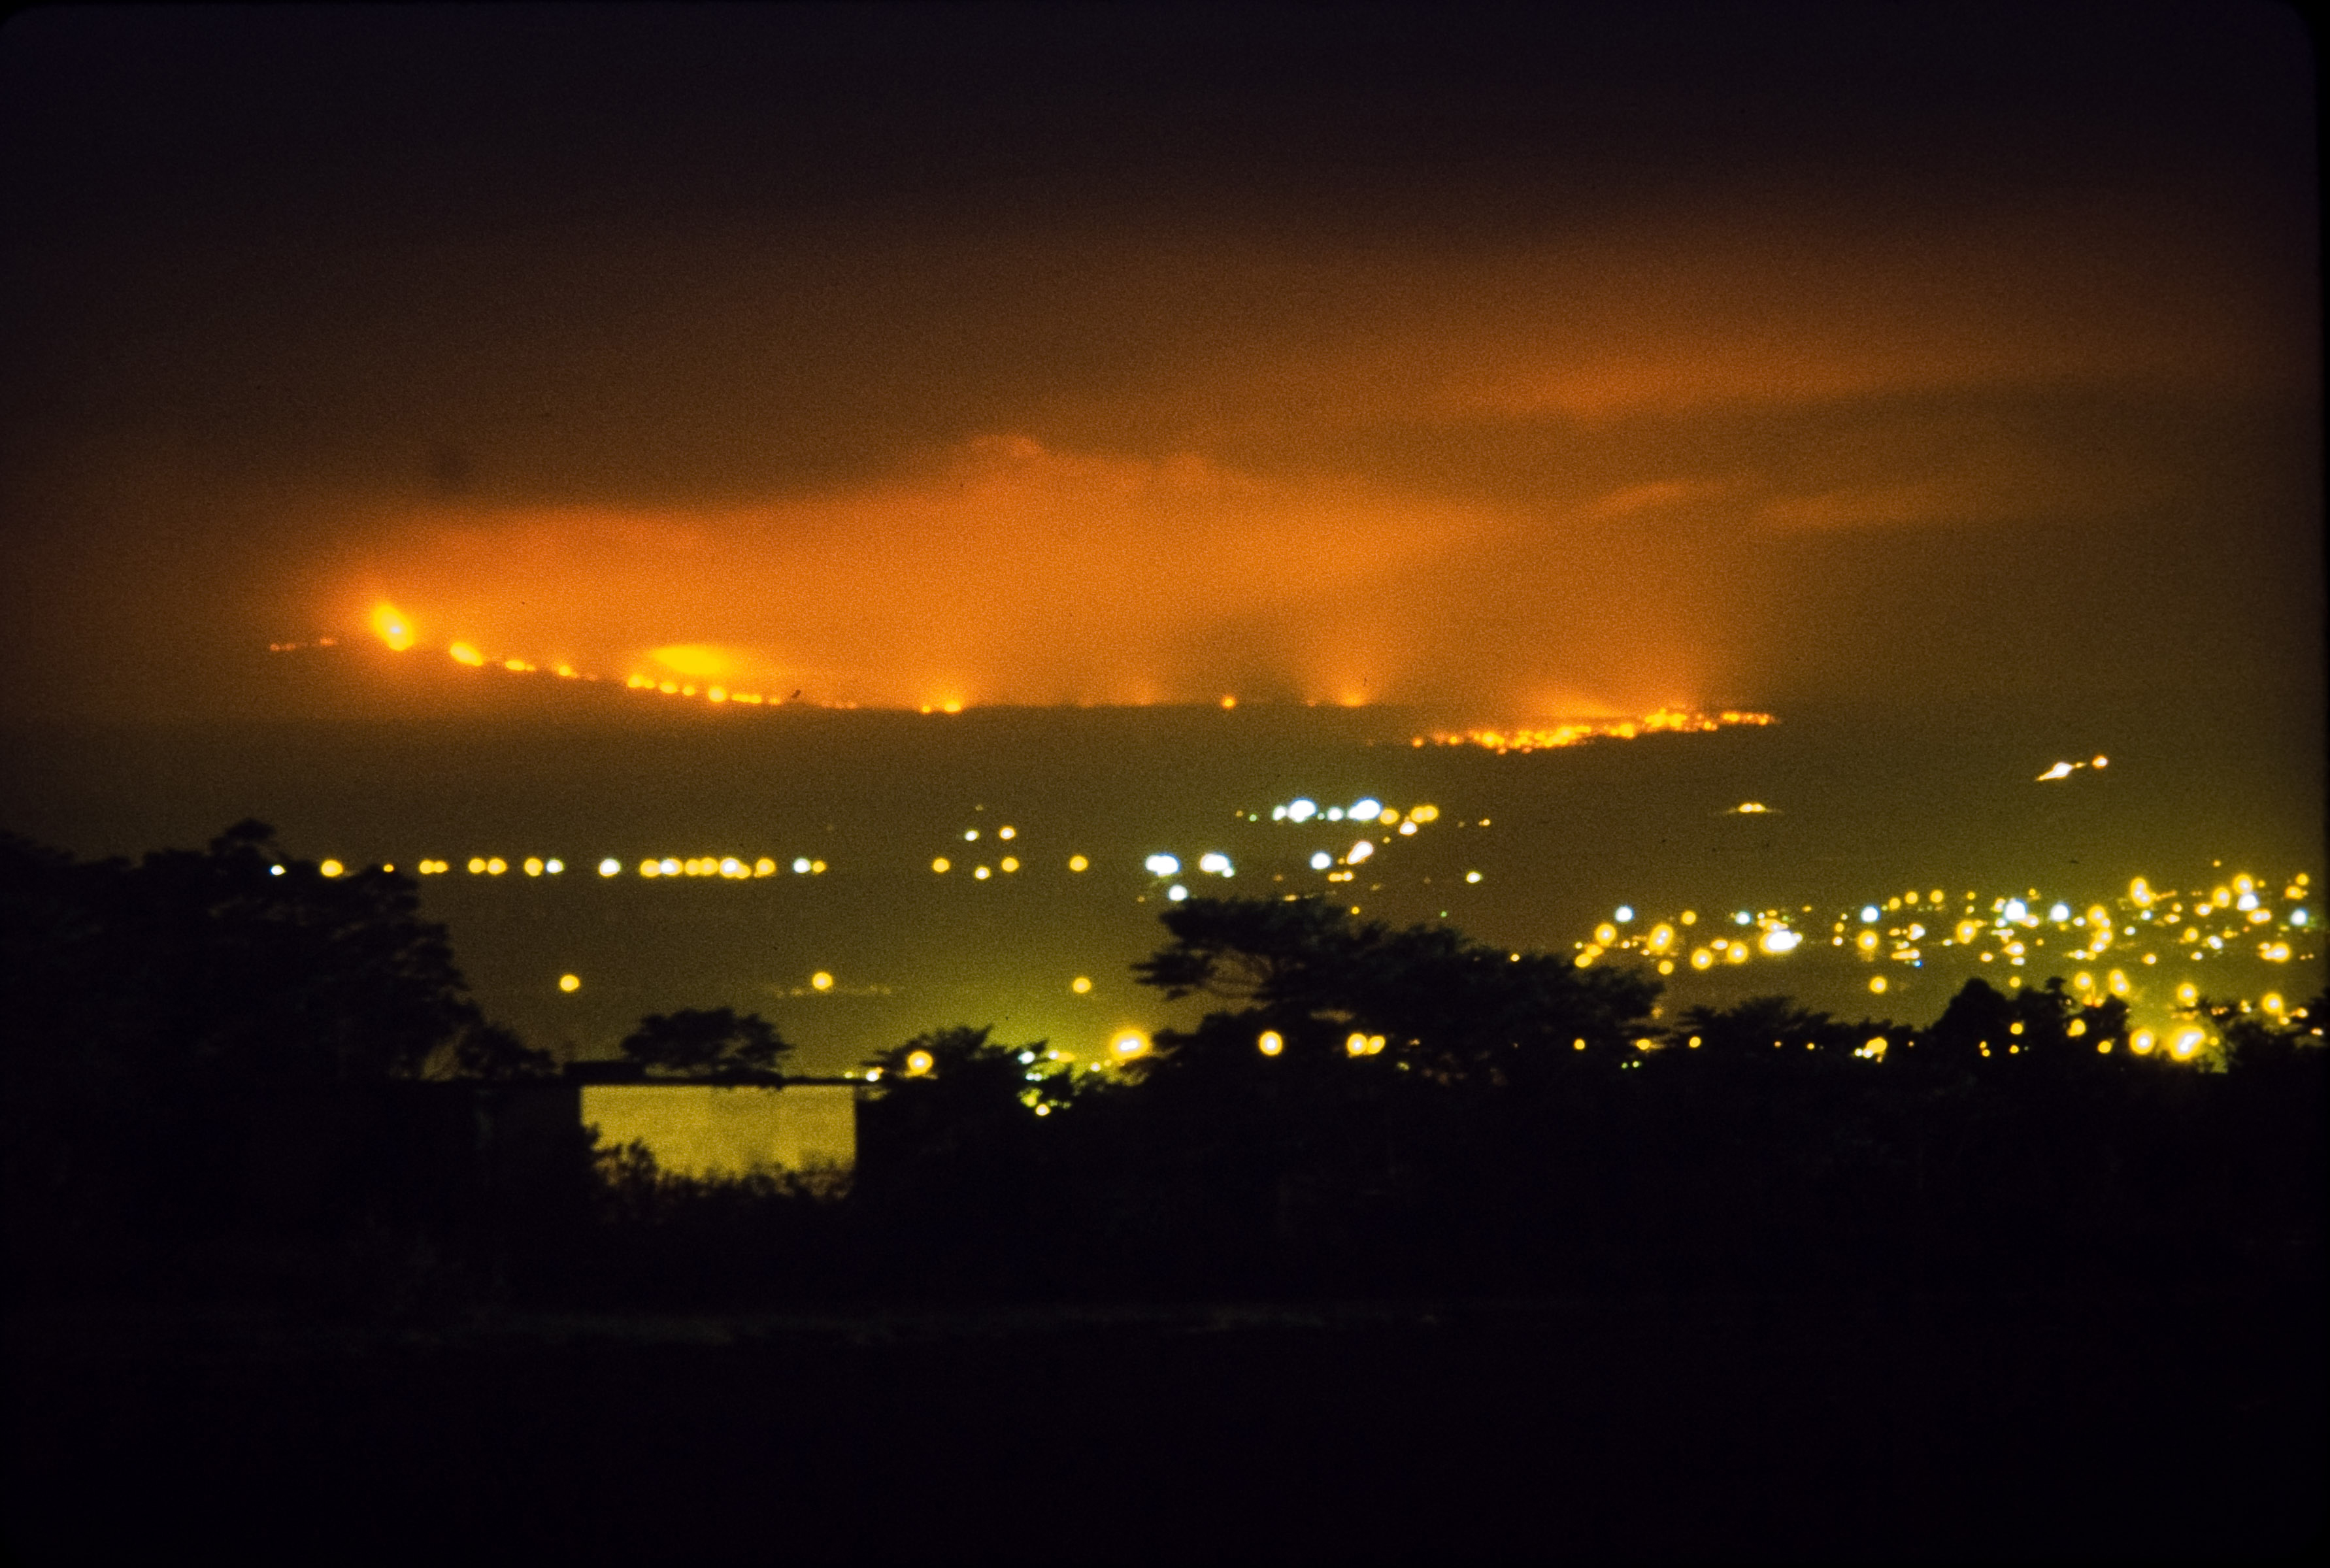
Glow from a Mauna Loa lava flow lit up the night sky above Hilo on April 4, 1984. In this photo, captured from near the Hilo airport, the flow front appears closer to the city than it actually was. Should a similar eruption occur in the future, the U.S. Geological Survey’s lava flow inundation maps could help alleviate concern for residents outside the identified inundation zone for a given flow. Photo courtesy of David Little.
The inundation zones identified on the maps are: Kaumana, Waiākea, and Volcano-Mountain View (Sheet 2); Kapāpala (Sheet 3); Pāhala, Punalu‘u, and Wood Valley (Sheet 4); Nā‘ālehu (Sheet 5); Kalae (Sheet 6); Hawaiian Ocean View Estates, Kapu‘a, and Miloli‘i (Sheet 7); Ho‘okena, Ka‘ohe, and Ka‘apuna (Sheet 8); Hōnaunau and Kealakekua (Sheet 9); and Puako (Sheet 10).
The boundaries between inundation zones are approximate. The names given for each sheet are descriptive, and are meant to represent the larger geographic areas of potential lava inundation. Map scales vary from 1:45,000 to 1:85,000.
The Mauna Loa lava flow inundation maps and related GIS files are now available online. HVO also plans to distribute paper copies of the maps to public libraries around the Island of Hawaiʻi in the next month or so.
ARTICLE CONTINUES BELOW AD
Volcano Activity Updates
This past week, Kīlauea Volcano’s summit lava lake level fluctuated with summit inflation and deflation, ranging about 98–118 ft below the vent rim. On the East Rift Zone, the 61g flow remained active, with lava reaching the Kamokuna delta and surface breakouts downslope of Pu‘u ‘Ō‘ō. The 61g flows do not pose an immediate threat to nearby communities.
Mauna Loa is not erupting. Small-magnitude earthquakes occurred beneath the summit caldera and upper Southwest Rift Zone, mostly at depths less than 3 miles, with some deeper events at depths of 3–8 miles. GPS and satellite radar measurements continue to show deformation related to inflation of a magma reservoir beneath the summit caldera and upper Southwest Rift Zone. No significant changes in volcanic gas emissions were measured.
Two earthquakes with three or more felt reports occurred on the Island of Hawaiʻi during the past week: A magnitude-3.1 earthquake 3 miles south of Volcano at 1 mile depth on Oct. 21, at 12:01 a.m. HST, and a magnitude-3.1 earthquake 2 miles southeast of Leilani Estates at 1 mile depth on Oct. 19, at 12:09 p.m. HST.
Volcano Watch is a weekly article and activity update written by US Geological Survey Hawaiian Volcano Observatory scientists.
This comments section is a public community forum for the purpose of free expression. Although Big Island Now encourages respectful communication only, some content may be considered offensive. Please view at your own discretion. View Comments